EDS 2026
Toggle navigation
Home
Data
Main table
Regional overview table
Main table
Regional overview
Rankings
Regional Barplots
Maps
Definitions
Datasheet 2024
Archive
Maps
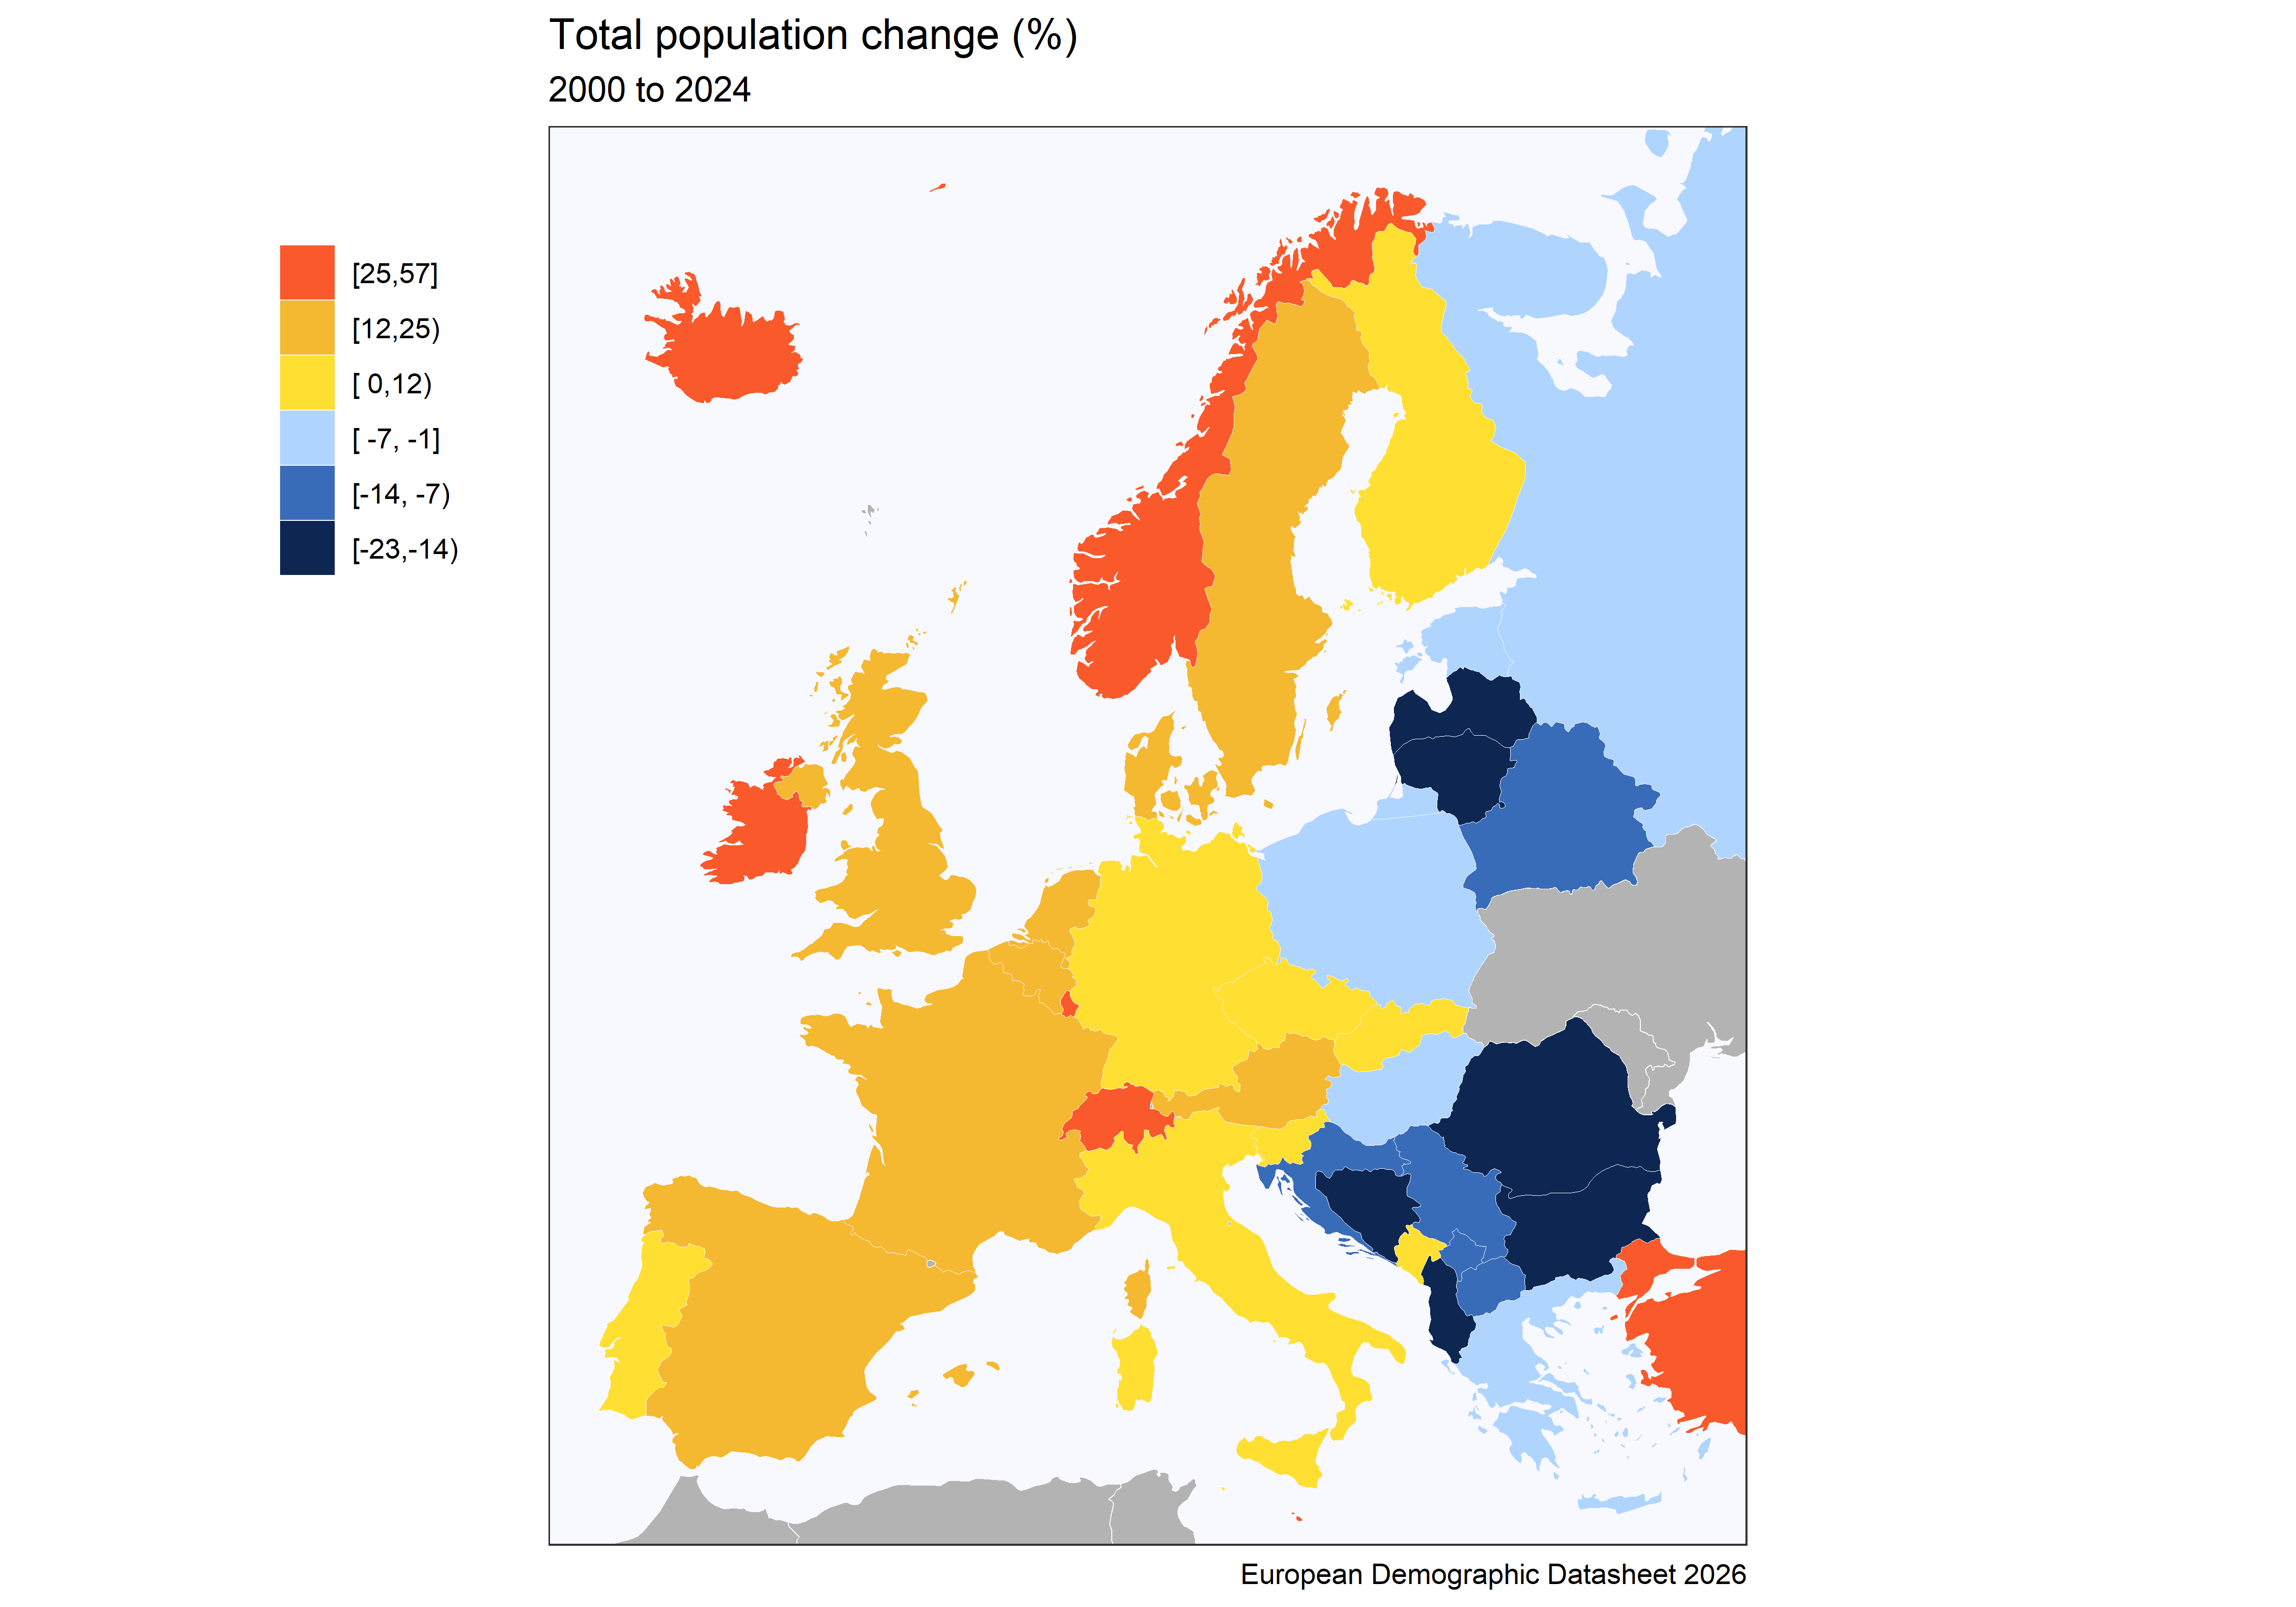
Total population change (%) (2000 to 2024)
Net migration (%) (2000 to 2024)
Natural population change (%) (2000 to 2024)
Proportion of population aged 65+ (%) (1.1.2025)
Proportion of foreign-born population (%) (1.1.2025)
Total fertility rate (TFR) (2024)
Tempo- and parity-adjusted TFR (2022)
Mean age at first birth (years) (2024)
Completed cohort fertility (cohort 1984)
Cohort childlessness (%) (cohort 1984)
Change in TFR (2019 to 2024)
Life expectancy at birth (years) of Women (2024)
Life expectancy at birth (years) of Men (2024)
Healthy Life Years of Women (2023)
Healthy Life Years of Men (2023)
Excess deaths 2020-2023 (%) (2020 to 2023)
Working from home (%) (2024)
Top-half benefit ratio (2022)
Persons at risk of poverty and social exclusion at age <65 (%) (2024)
Persons at risk of poverty and social exclusion at age 65+ (%) (2024)
Old-age benefit ratio (2022)
Job-protected leave after birth (weeks) (2024)
Co-parent leave (weeks) (2024)
CLICK TO ENLARGE
GET THE IMAGE
X
+