
European Demographic Datasheet 2024
Explore, visualize and compare population indicators for 45 European countries and regions.

Bernhard Rengs and Kryštof Zeman
Figures:
Figure 1: Ranking of states hosting Ukrainian refugees (excl. Ukraine and Russia), 2023
Figure 2: Map of the proportion of Ukrainian refugees in relation to the total population of the host country, 2023
Figure 3: Map of the proportion of non-Ukrainian refugees in relation to the total population of the host country, 2023

Tomáš Sobotka, Kryštof Zeman, and Zuzanna Brzozowska
In Europe, the mean age at first birth has been rising since the 1970s, in many countries surpassing 30 years during the last decade. This trend distorts the most common measure of period fertility, the total fertility rate (TFR). As births shift to later ages, they are both postponed into the future and spread over a longer period of time. This "stretching" of reproduction depresses period TFR, even if the number of children that women have over their reproductive lives (completed cohort fertility) does not change. A possible correction of this “tempo effect” is offered by the tempo- and parity-adjusted total fertility rate (TFRp*), an indicator based on age- and parity-specific fertility rates, as well as changes in the mean ages at birth (Bongaarts and Sobotka 2012). It provides a more accurate measure of the period mean number of children per woman, and often differs substantially from the TFR.
The figures illustrate the trends in the TFR and TFRp* in four European countries. In Hungary, which experienced a sharp fall in the TFR coupled with intensive first birth postponement after 1990, a wide gap between the conventional TFR and the tempo-adjusted TFRp* appeared around 2000. However, this gap gradually closed over the next two decades, as fertility levels declined in the 2000s and fertility postponement slowed down in 2010s, resulting in a rise in the TFR. The much-discussed policy-driven increase in Hungarian fertility in the 2010s looks rather modest when considering that the TFRp* remained at a stable level of around 1.5 during that period. Similarly, in Portugal, the TFR recovered from a very low level of 1.2 reached in 2013 to 1.5 one decade later, while the TFRp* remained broadly stable at around 1.6 during that period.
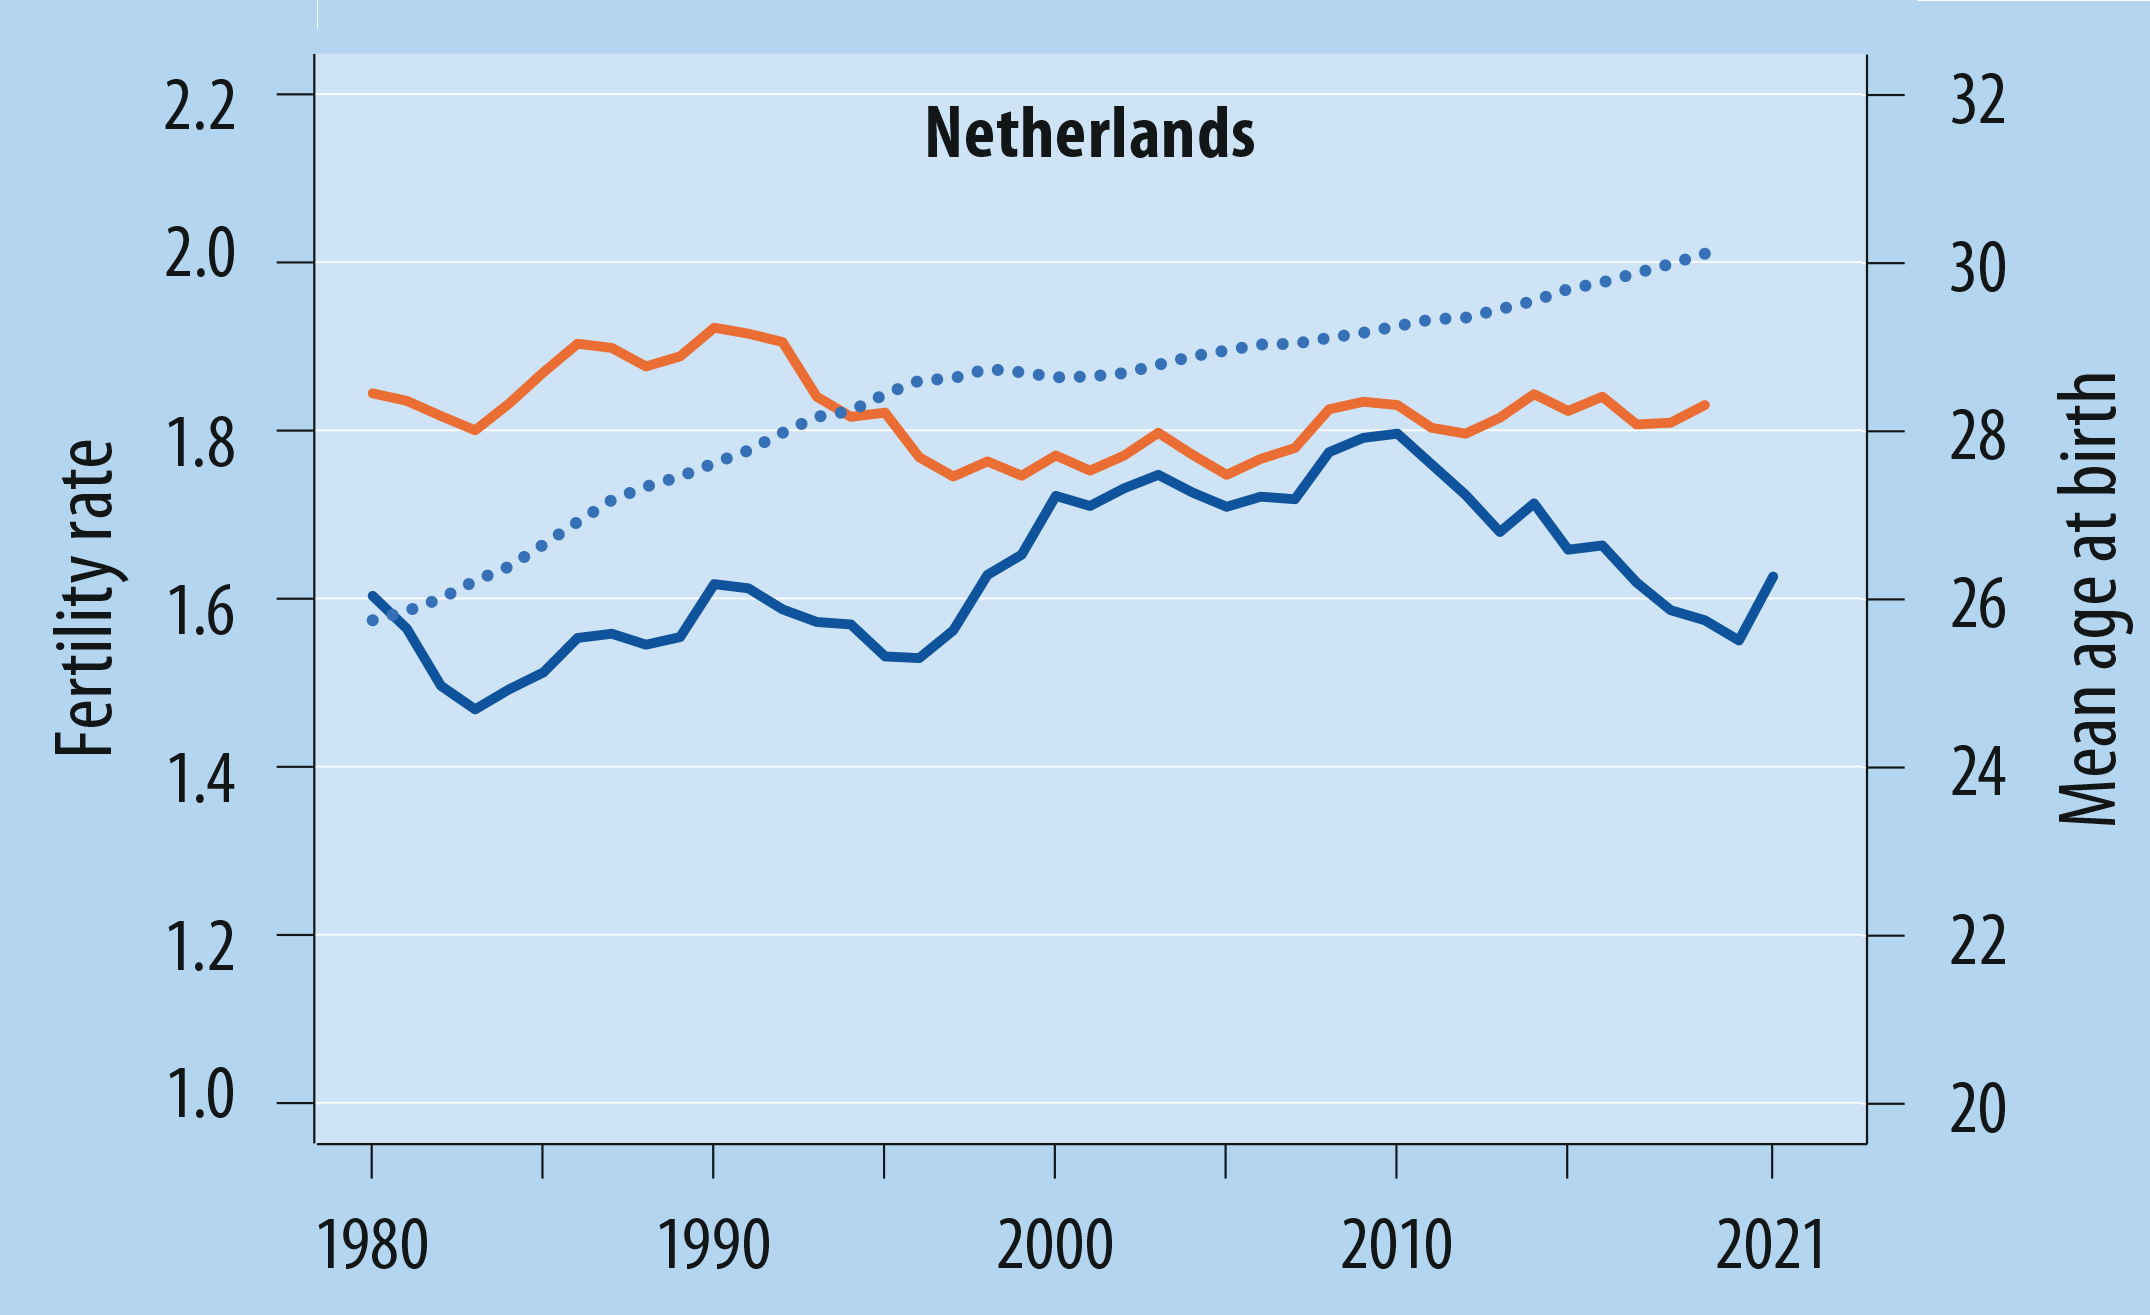
At the same time, the TFR fell sharply in many other European countries after 2010. Some of the largest TFR declines took place in the Nordic countries. In Norway, the decrease in the TFR was driven by a combination of declining fertility levels and accelerating first birth postponement (fuelling the tempo effect). Both the TFR and the TFRp* dropped substantially, but the fall in the TFR was steeper, from almost 2.0 in 2010 to 1.4 in 2022. The TFRp* remained consistently higher, declining from 2.1. to 1.7 over the same period. By contrast, the Netherlands enjoyed a remarkably stable TFRp* of around 1.8 over the last three decades, despite substantial ups and downs in the TFR in that period, including a decline after 2010.
Figures:
Figure 1: Fertility trends in Hungary, 1980–2022
Figure 2: Fertility trends in Portugal, 1980–2022
Figure 3: Fertility trends in Norway, 1980–2022
Figure 4: Fertility trends in the Netherlands, 1980–2022
References:
Bongaarts, J. and Feeney, G. 1998. On the quantum and tempo of fertility. Population and Development Review 24(2): 271–291. https://doi.org/10.2307/2807974
Bongaarts, J. and Sobotka, T. 2012. A demographic explanation for the recent rise in European fertility. Population and Development Review 38(1): 83–120. https://doi.org/10.1111/j.1728-4457.2012.00473.x

Tomáš Sobotka and Kryštof Zeman
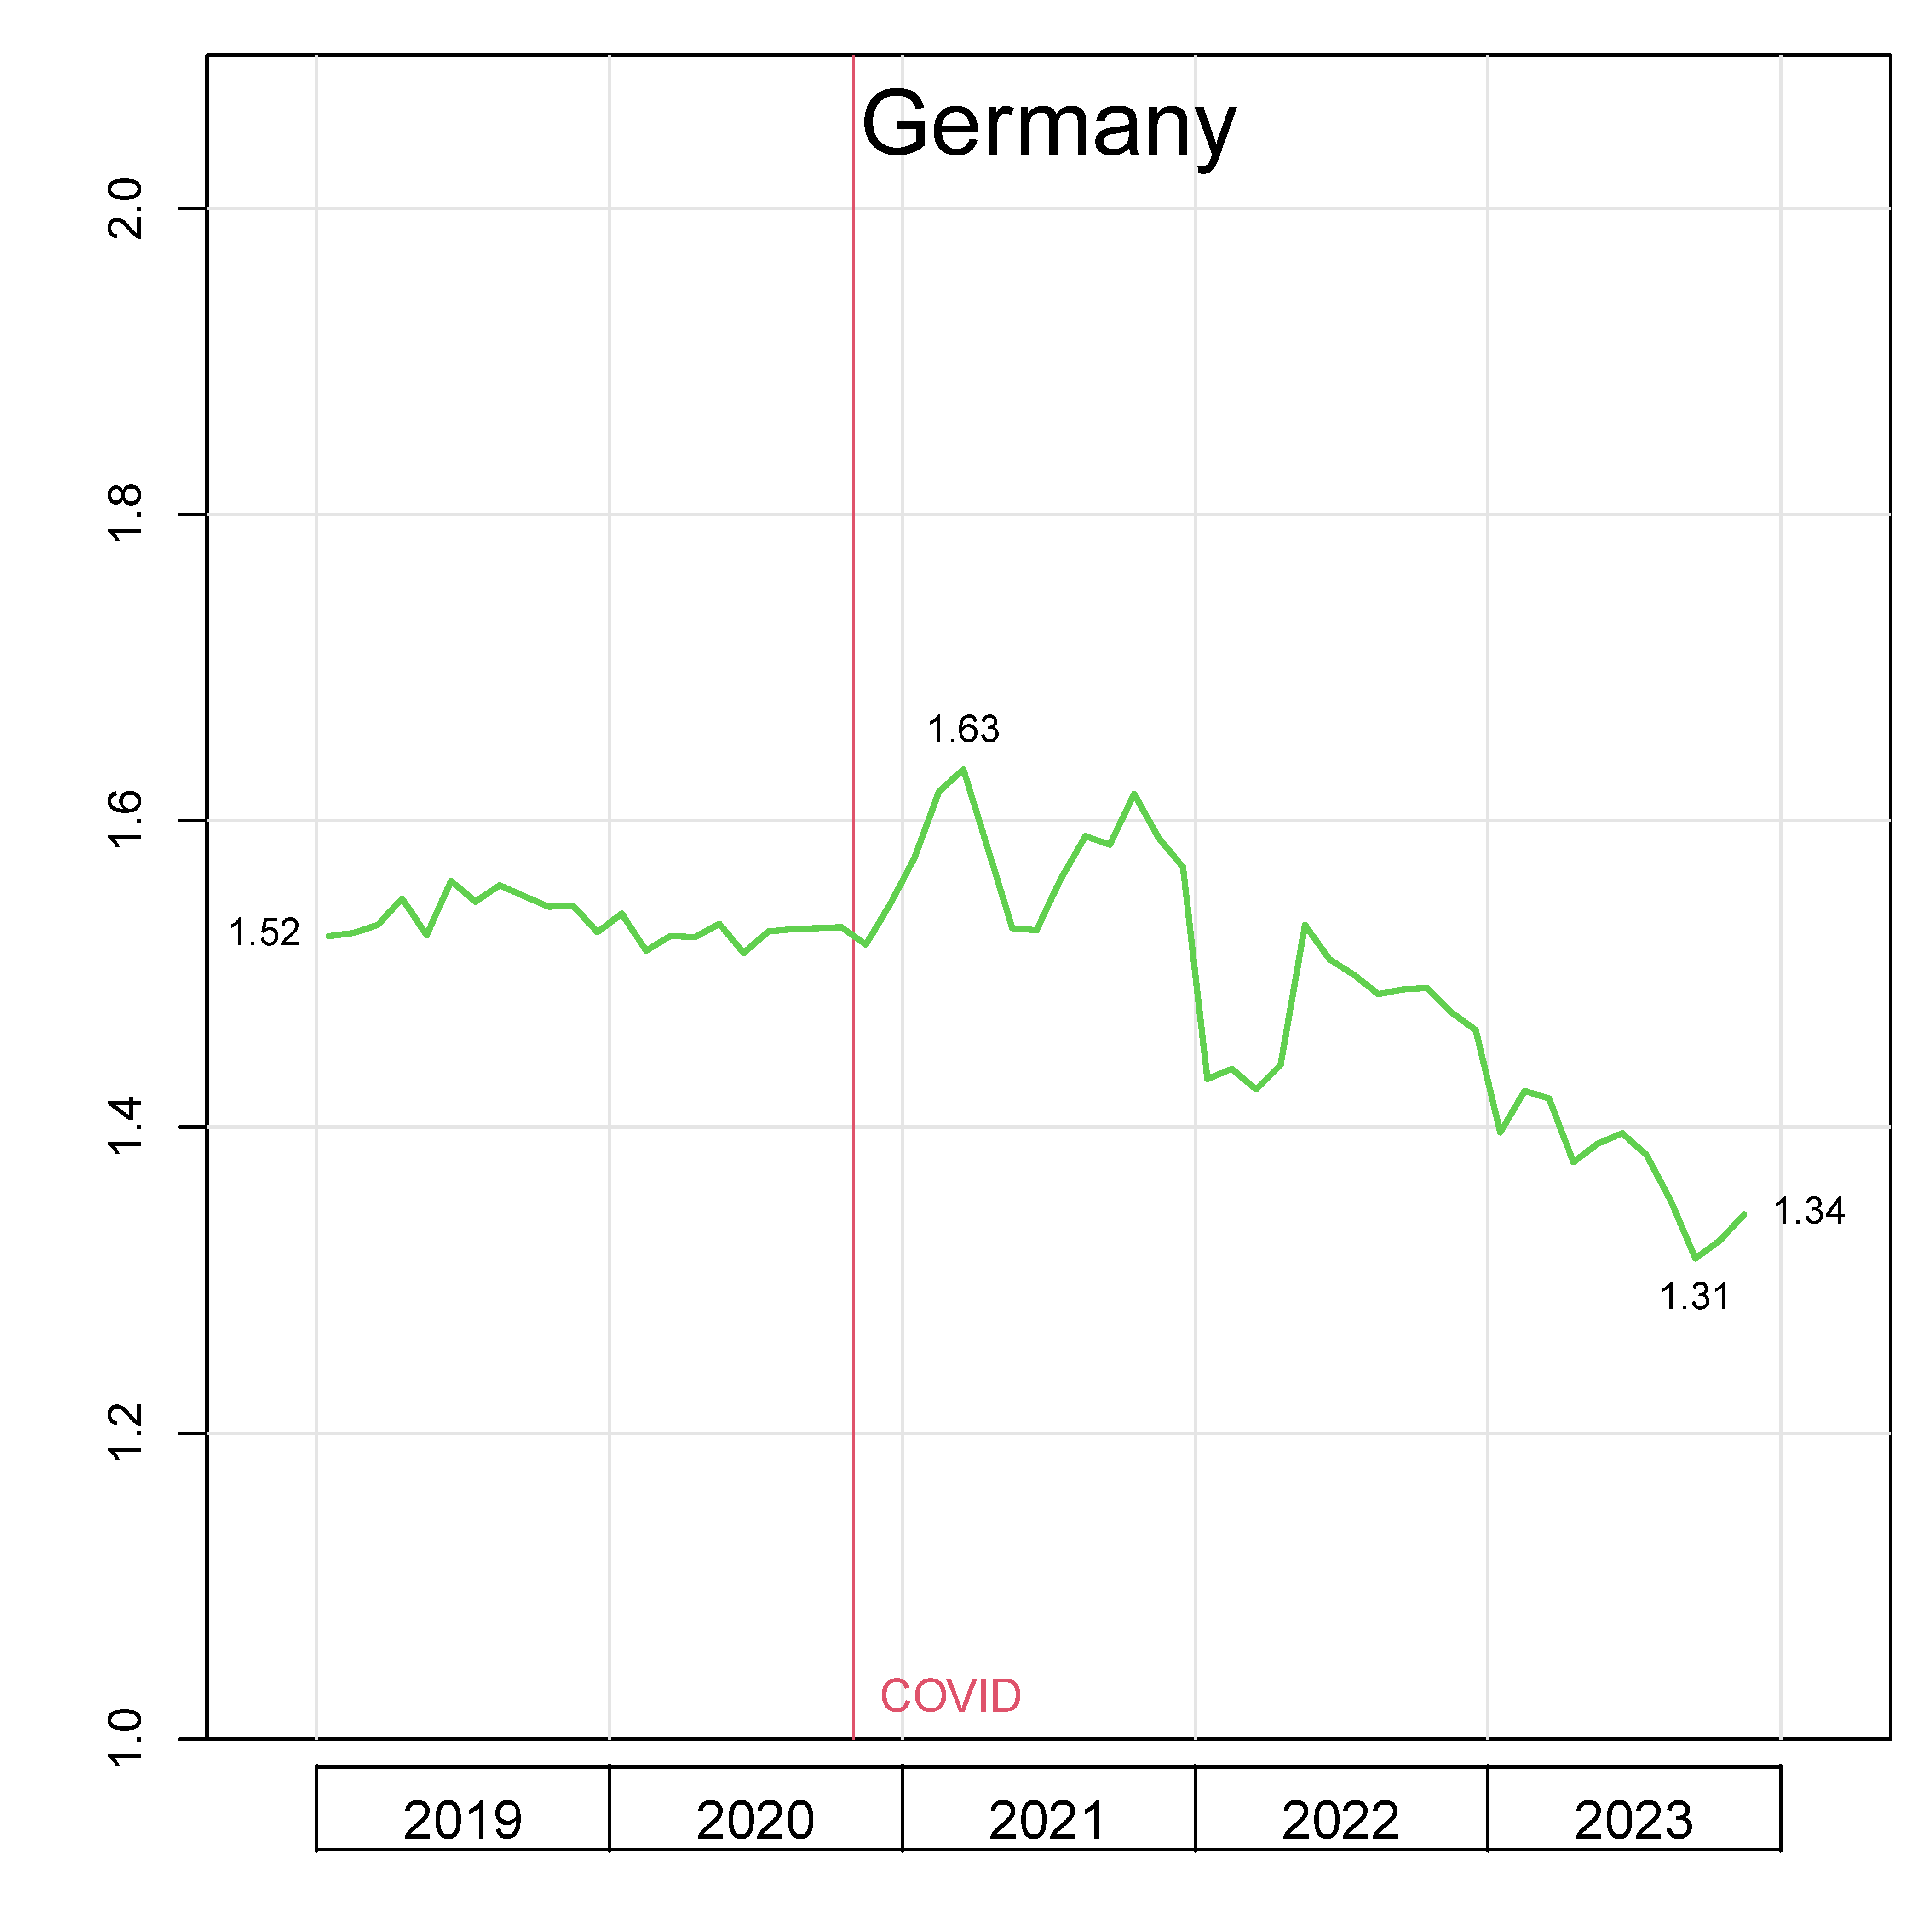
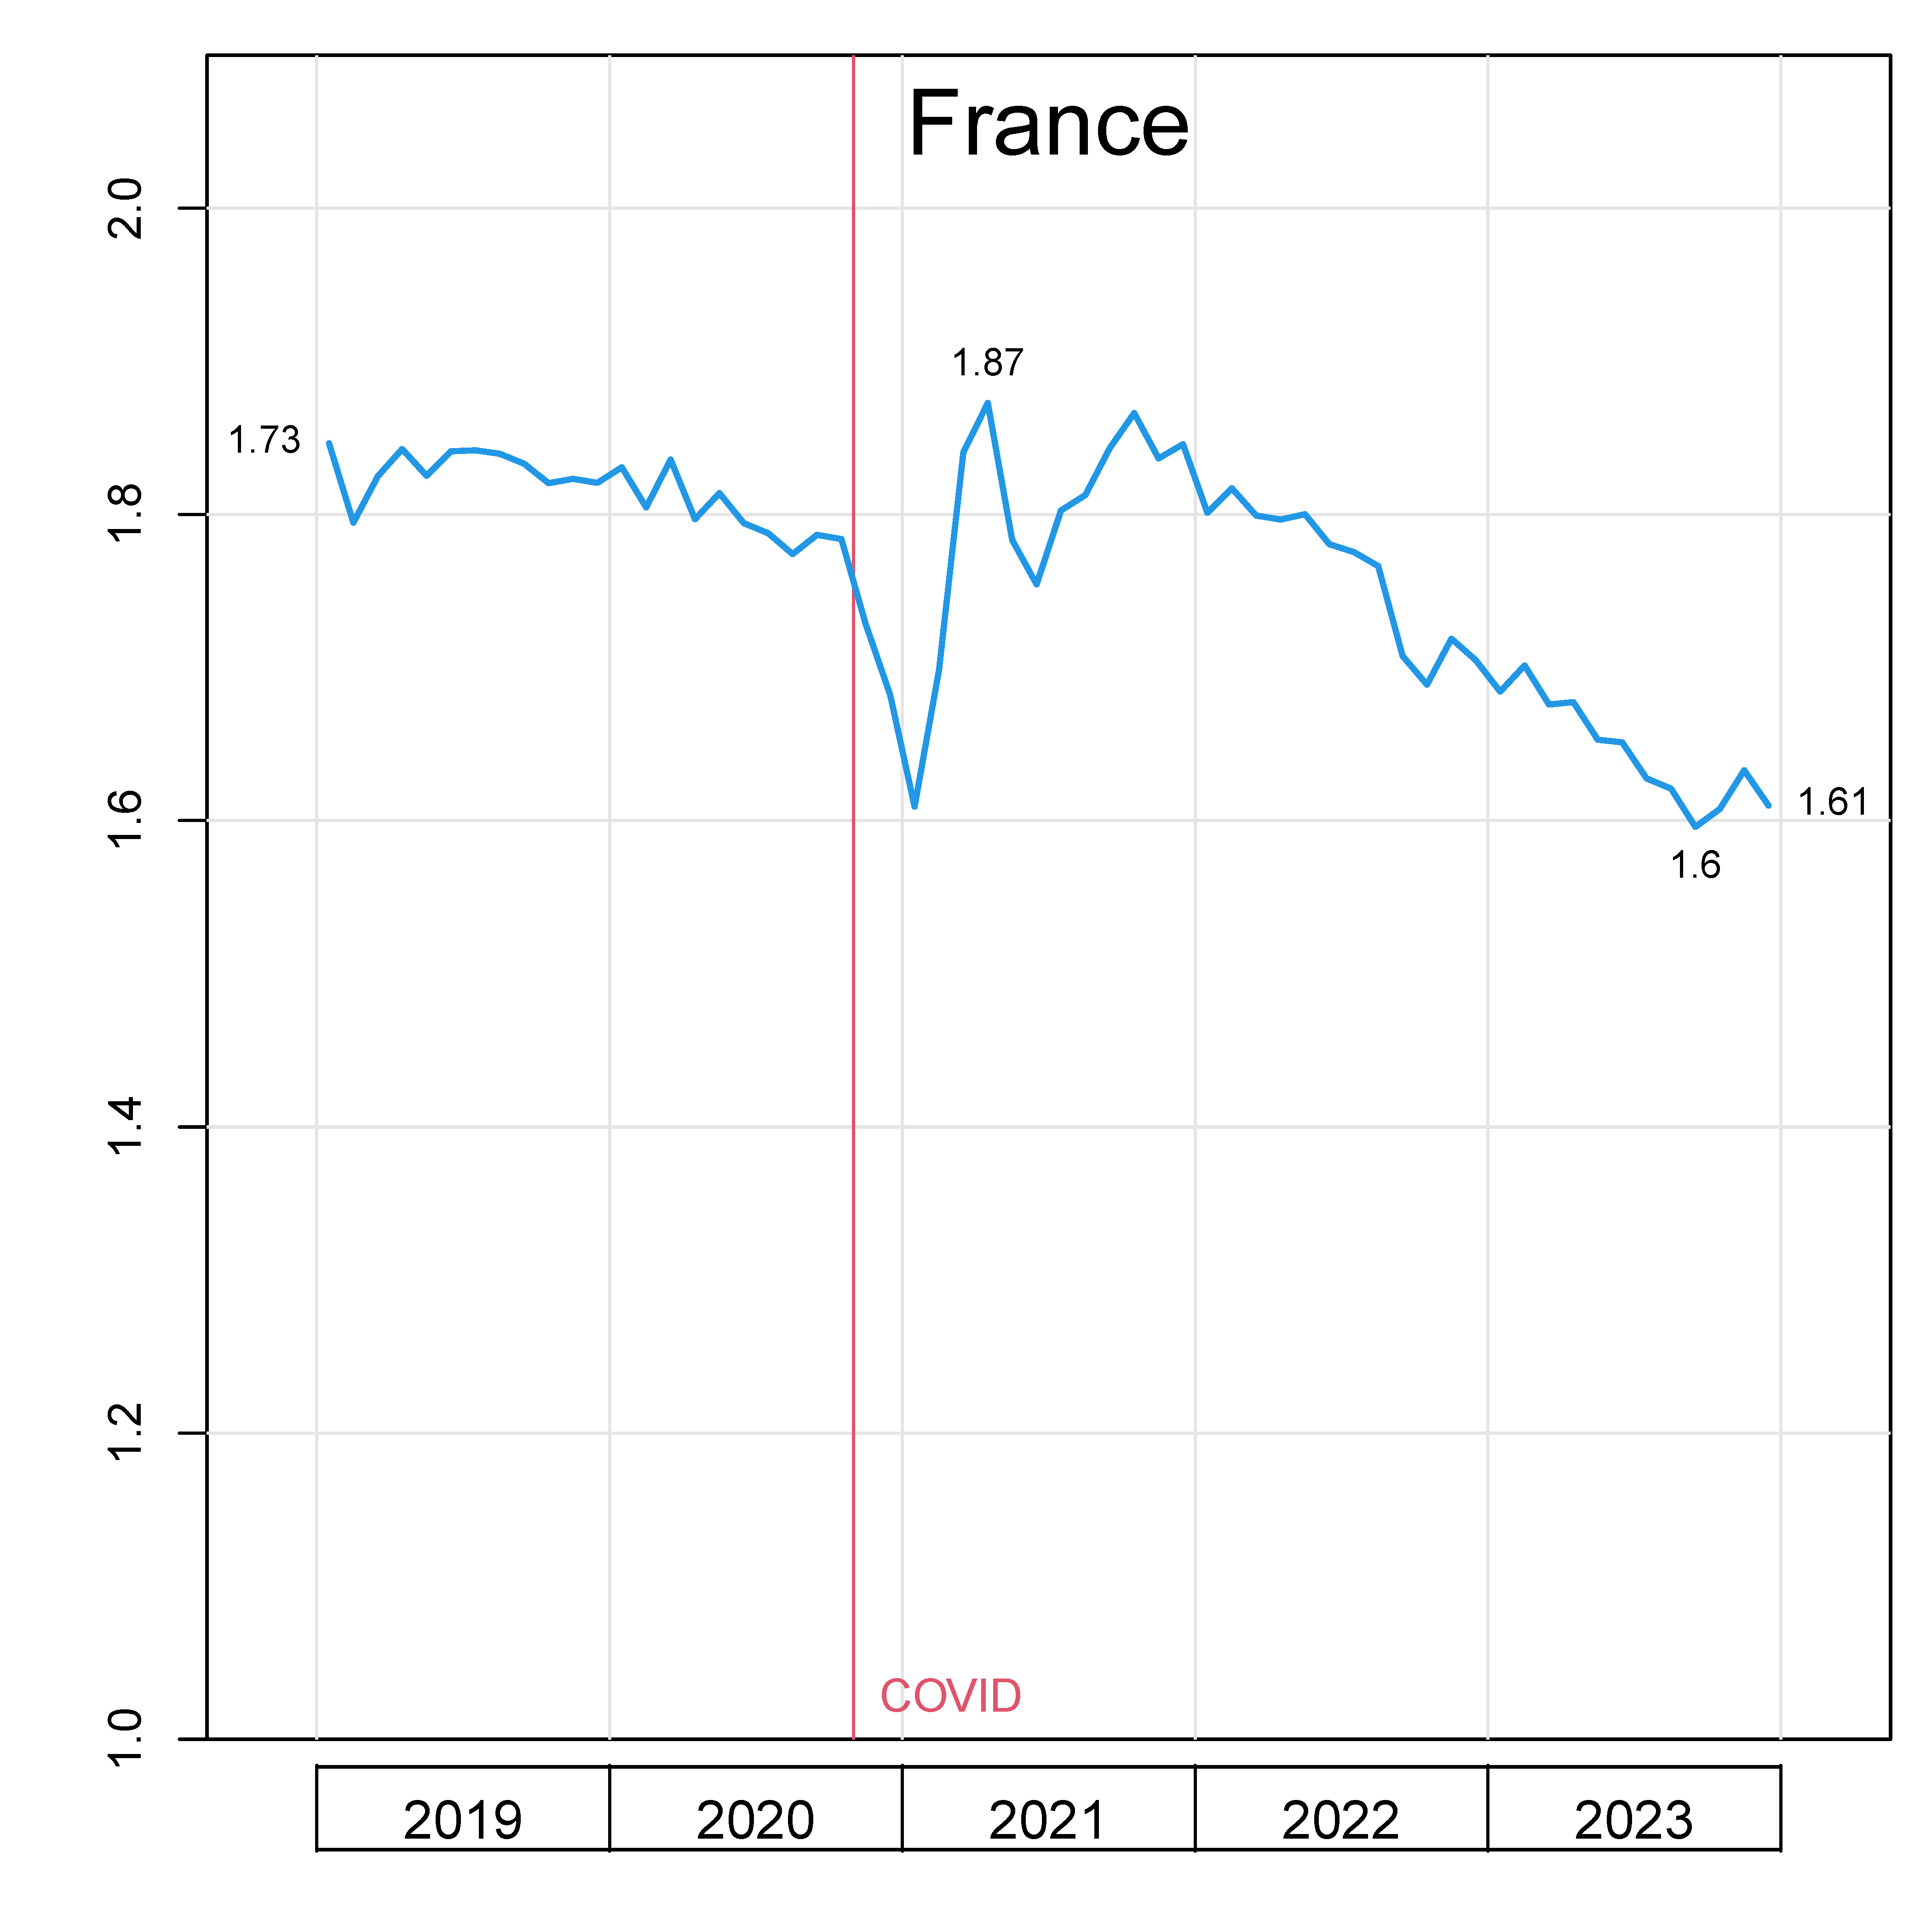
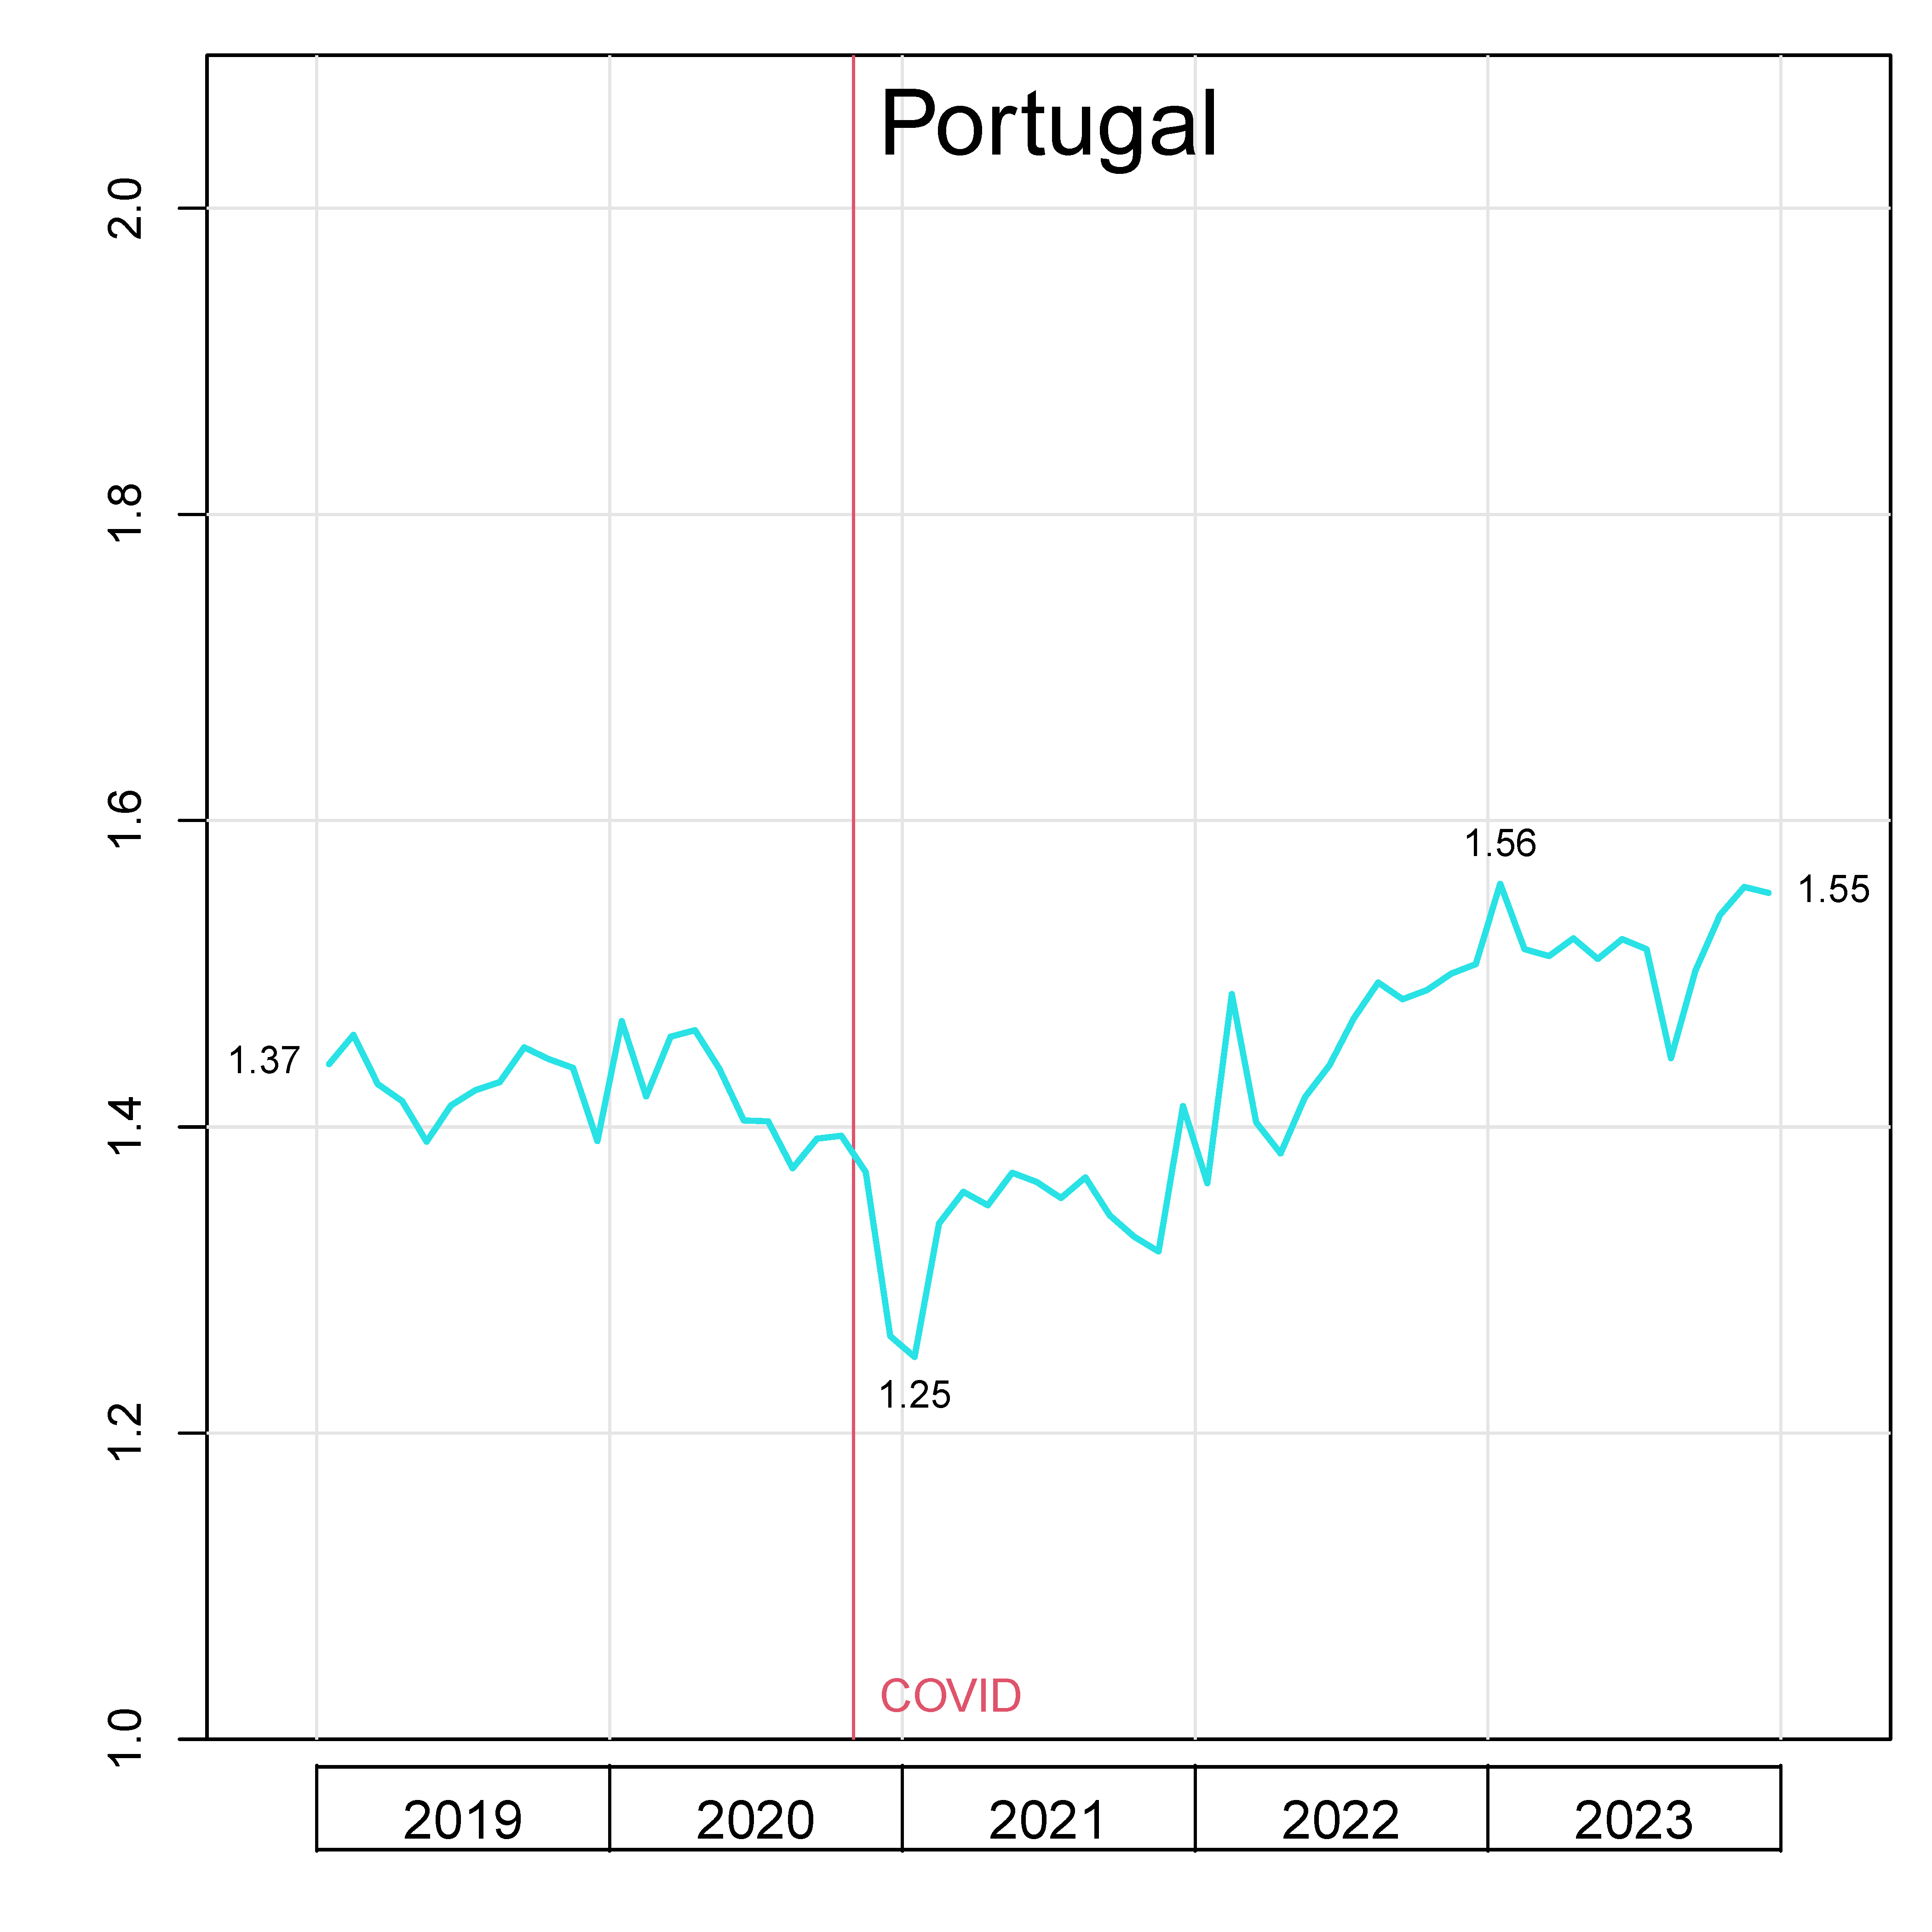
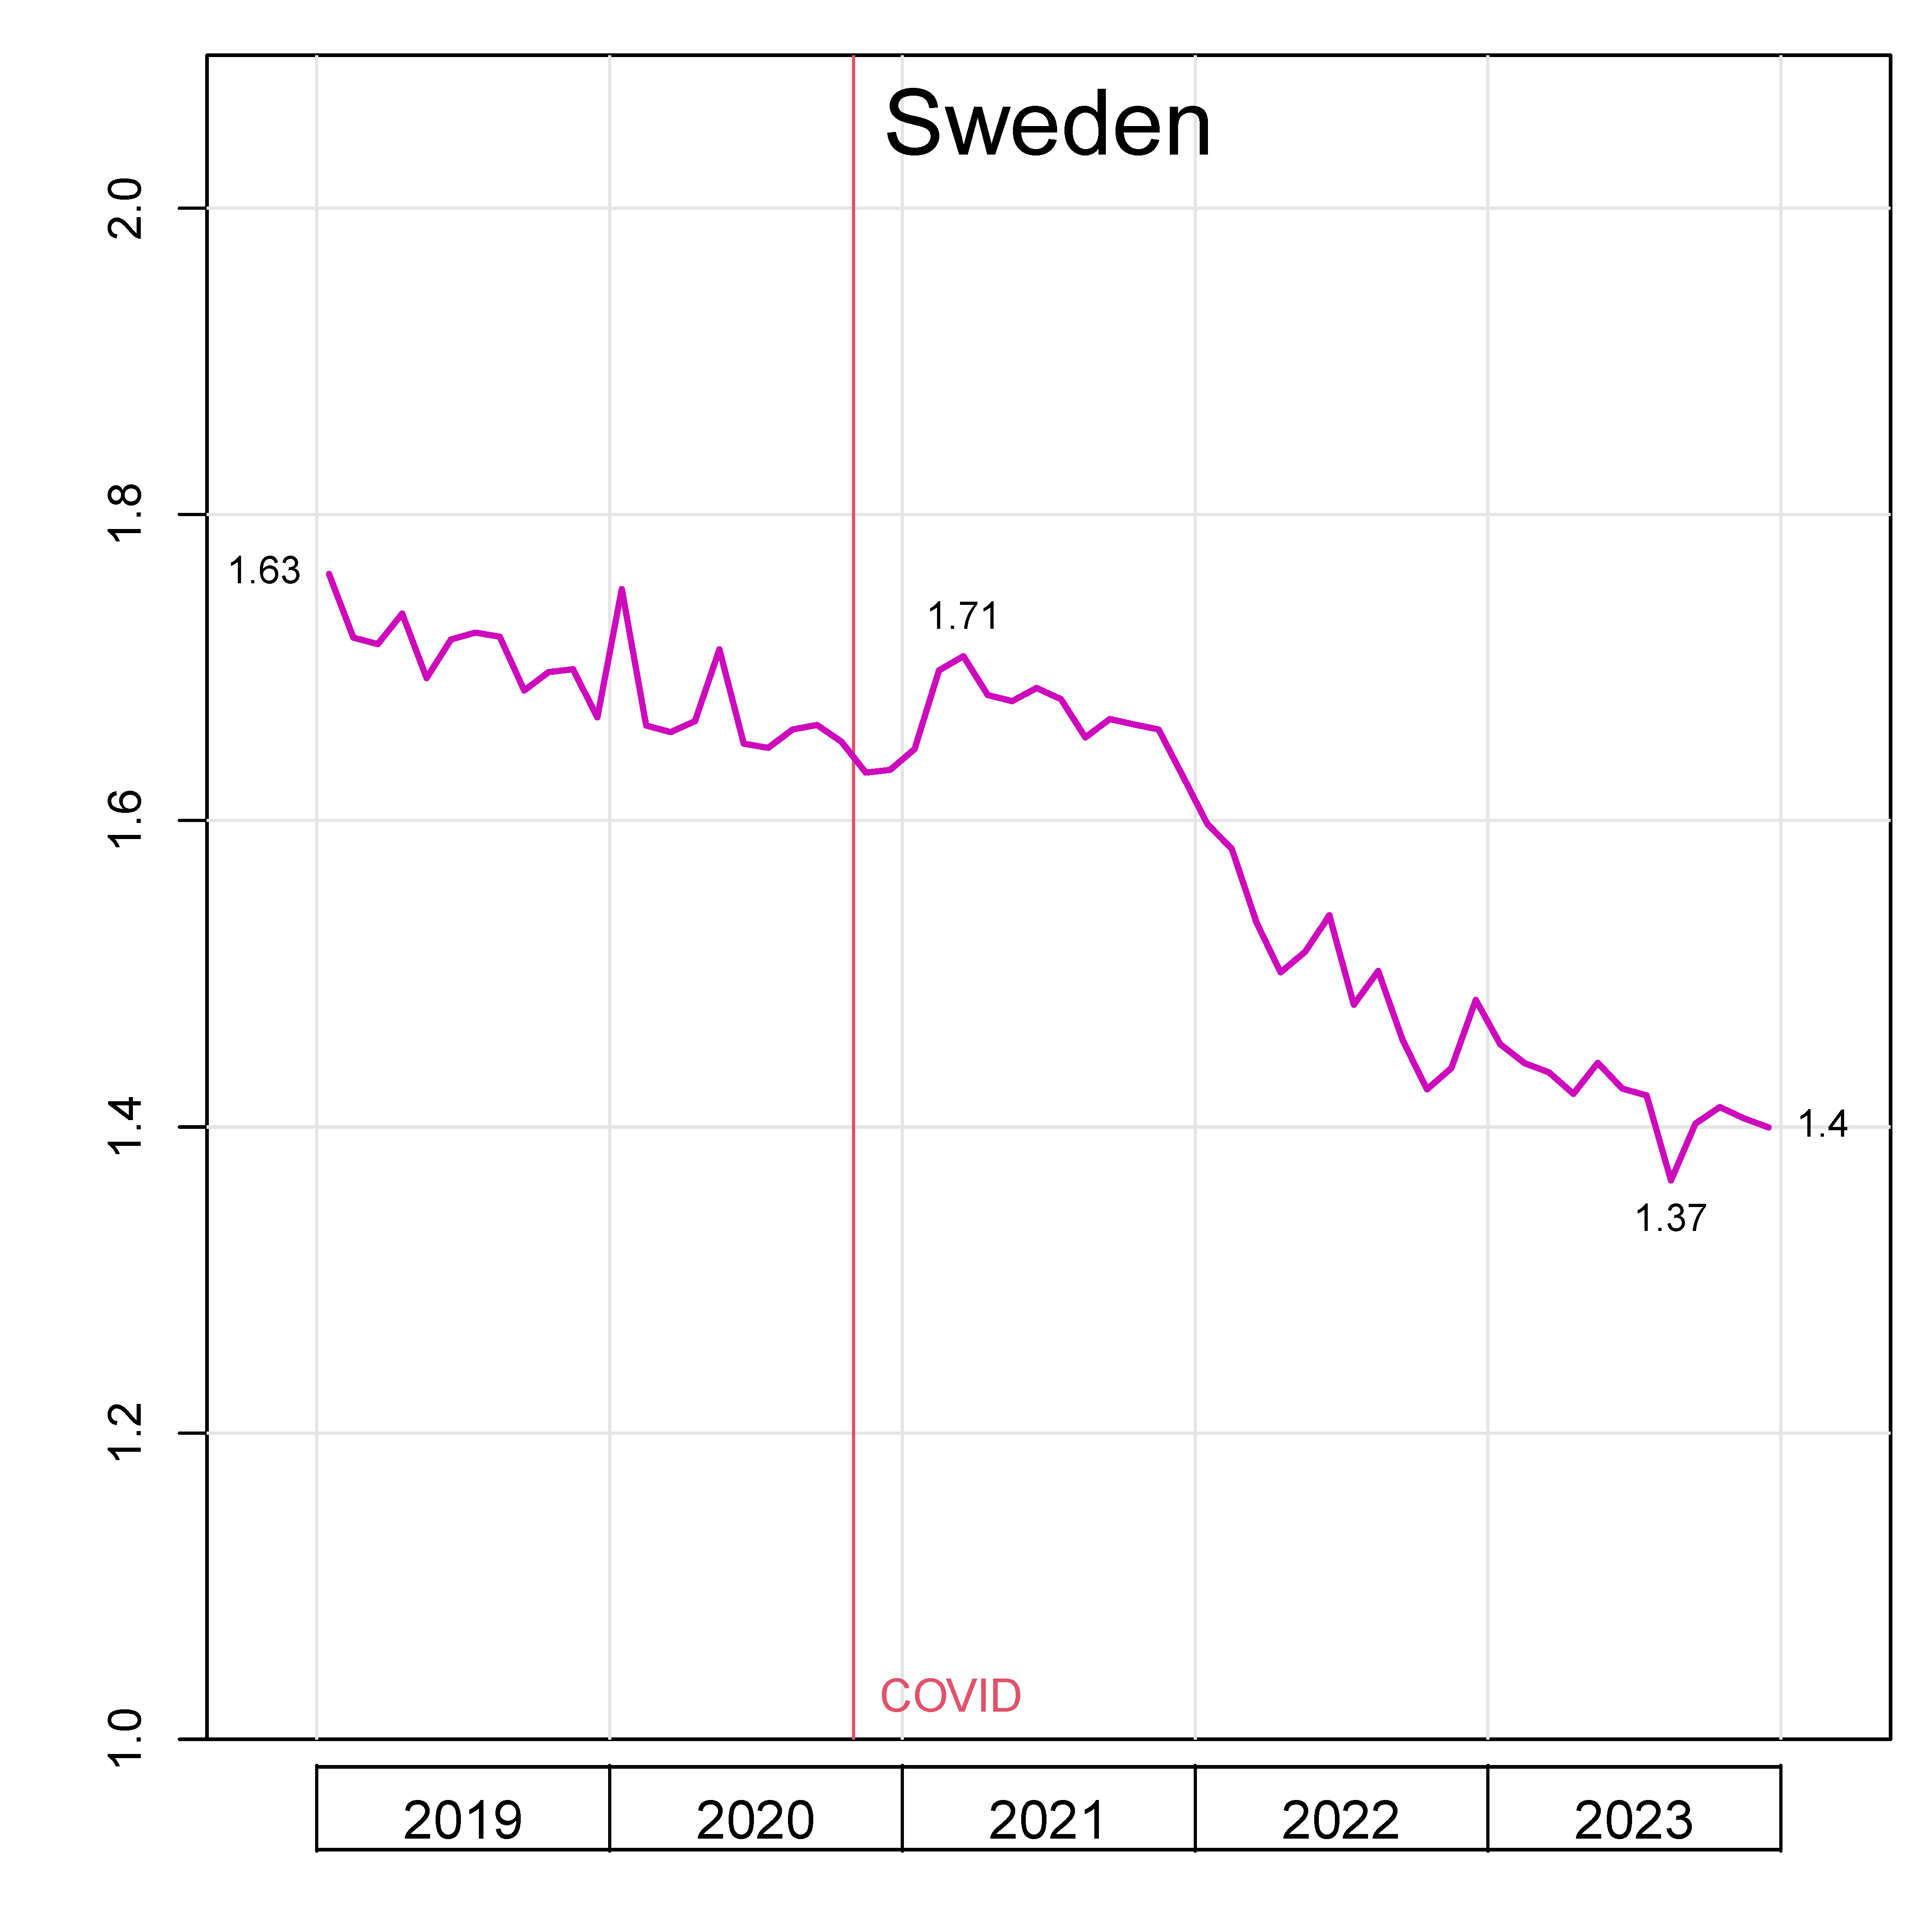
Period fertility rates often display sharp fluctuations, especially in times characterised by economic and political upheavals and policy changes. We illustrate the imprint left by the COVID-19 pandemic on period fertility dynamics using monthly estimates of the period total fertility rate (TFR) published in the Short-Term Fertility Fluctuations (STFF) data series within the Human Fertility Database. The figure shows TFR trends from January 2019 to December 2023 in five European countries with different fertility levels: Czechia, Germany, France, Portugal, and Sweden. The monthly data format allows us to explore short-term fertility movements that would not be visible in the annual time series.
The graphs reveal several patterns. First, they confirm that the period of the COVID-19 pandemic, which affected birth trends starting in around December 2020 (conceptions starting in March 2020), was indeed characterised by instability, and, at times, sharp fluctuations in fertility. These fluctuations are visible especially in the early phase of the pandemic in Czechia, France, and Germany.
Second, the ups and downs in fertility followed a similar pattern in most countries. In response to the outbreak, fertility dropped in December 2020 and January 2021 in many countries (see France and Portugal). After the first pandemic wave petered out, fertility often swiftly recovered (see Czechia, France, and Germany) and the TFR frequently remained slightly above its pre-pandemic level throughout most of 2021. In early 2022, the fertility rates in most countries dipped unexpectedly and often continued falling into 2023 (Portugal was the major exception in Europe, with a gradual fertility recovery in 2022–2023). The downward turn in early 2022 resulted from the conceptions that occurred when pandemic-related restrictions were being lifted and the vaccination drive was underway. Later, rising inflation and the war in Ukraine fuelled uncertainty about the future, and might have led to falling fertility, especially in 2023.
Third, at the end of 2023, the sustained fertility declines in many countries often drove fertility to levels far below those recorded before the pandemic. In some countries, including in France and Sweden, the TFR reached all-time lows. The TFRs observed most recently in Germany (just above 1.3), Sweden (around 1.4), and France (1.6) are 0.2–0.3 lower than the rates before the pandemic in 2019–2020. In Czechia, fertility dropped even more sharply, from a long-time high of around 1.9 in March 2021 to below 1.5 in late 2023.
As inflation subsides and economies stabilise, fertility rates may plateau or even slightly recover from 2024 onwards. There are some hints of a levelling off of the TFR in the analysed countries during the last three months of 2023.
Figures:
Figure 1: Period fertility rates before, during and after the COVID-19 pandemic in Czechia, 2019–2023
Figure 2: Period fertility rates before, during and after the COVID-19 pandemic in Germany, 2019–2023
Figure 3: Period fertility rates before, during and after the COVID-19 pandemic in France, 2019–2023
Figure 4: Period fertility rates before, during and after the COVID-19 pandemic in Portugal, 2019–2023
Figure 5: Period fertility rates before, during and after the COVID-19 pandemic in Sweden, 2019–2023
References:
Human Fertility Database. Max Planck Institute for Demographic Research and Vienna Institute of Demography. www.humanfertility.org
Sobotka, T. et al. 2023. Pandemic roller-coaster? Birth trends in higher-income countries during the COVID-19 pandemic. Population and Development Review. https://doi.org/10.1111/padr.12544
Winkler-Dworak, M., K. Zeman, and T. Sobotka. 2024. Fertility decline in the later phase of the COVID-19 pandemic: The role of policy interventions, vaccination programmes, and economic uncertainty. medRxiv preprint. https://www.medrxiv.org/content/10.1101/2024.04.26.24306444v1

Vanessa di Lego
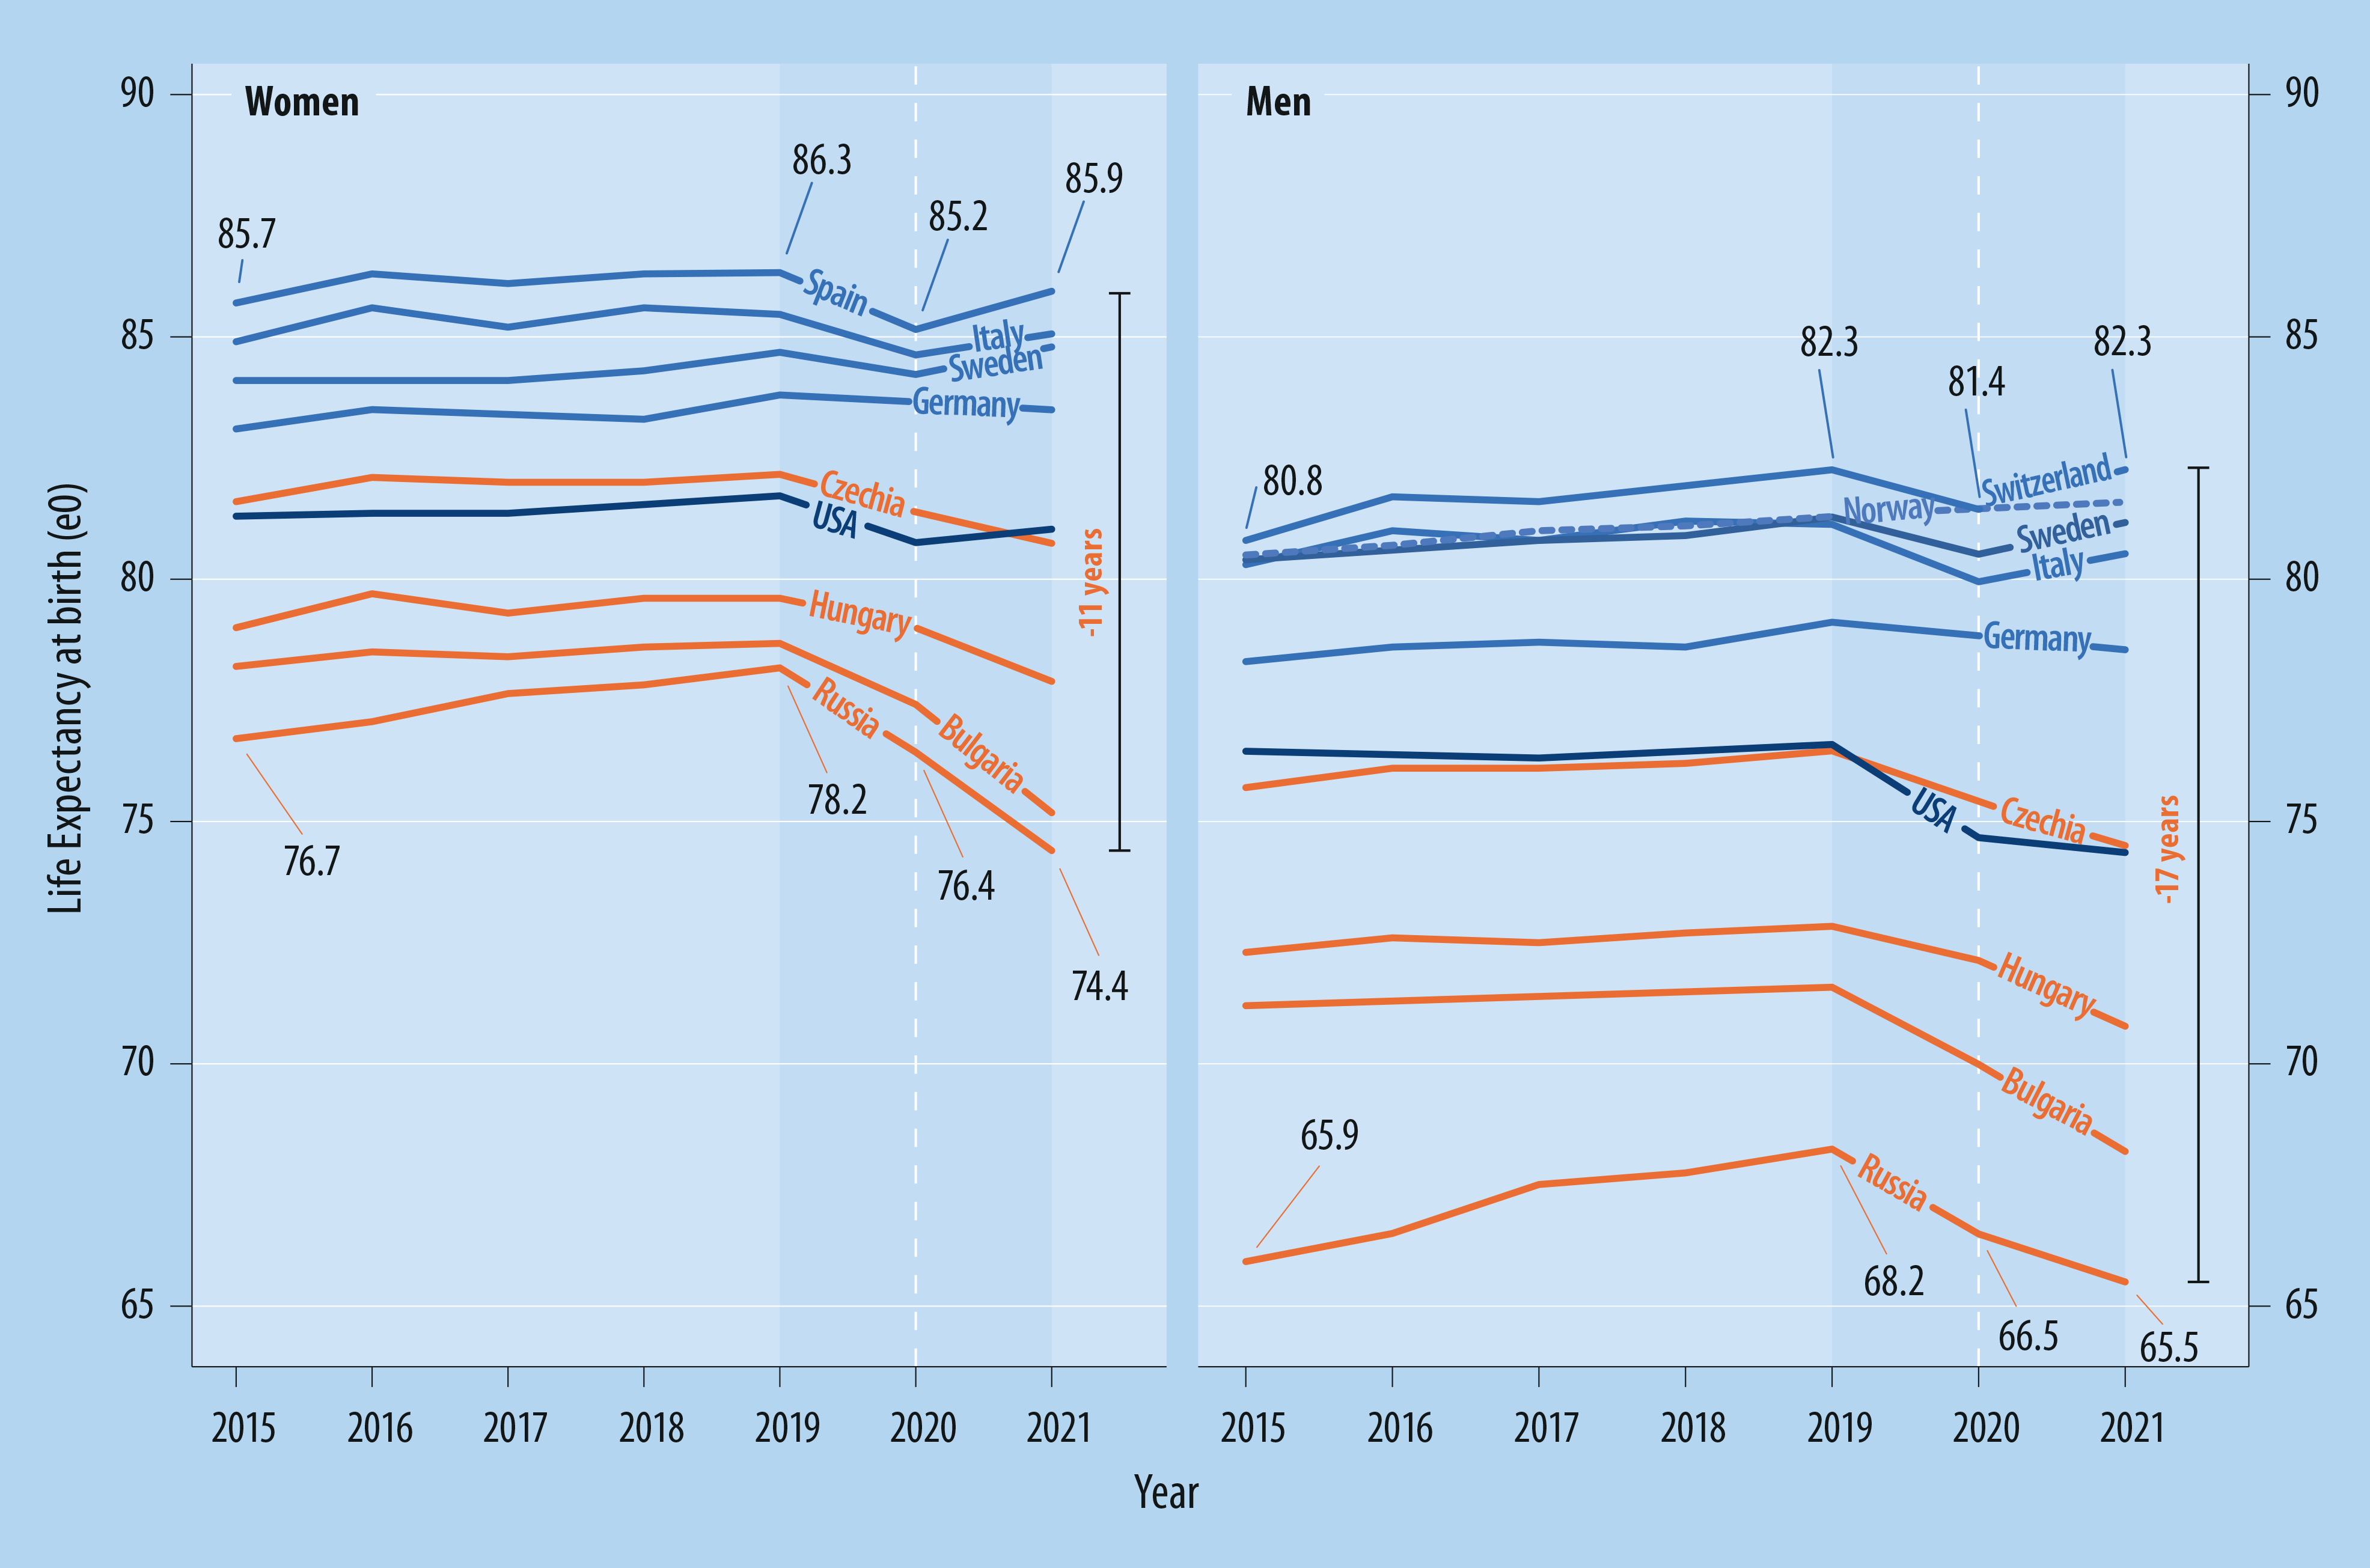
In the four years preceding the COVID-19 pandemic, most European countries faced either gradually increasing or stalling life expectancy, prompting discussions about a possible long-term halt or even reversal of longevity improvements. In addition, there was significant regional inequality, with Southern, Northern, and Western Europe, including Spain, Italy, and Sweden, having higher life expectancy than Eastern and Central European countries, such as Bulgaria, Romania, Poland, Hungary, and Czechia. The pre-pandemic gap in life expectancy at birth between Spain and Bulgaria was 9.5 years for men (81.1 vs. 71.6) and 7.9 years for women (86.7 vs. 78.8).
The COVID-19 pandemic disrupted this pattern, with three distinct phases of life expectancy change illustrated in the figure. In 2020, COVID-19 hit all countries hard, but particularly those with higher pre-pandemic life expectancy, specifically Spain, Italy, and Belgium. These countries experienced larger life expectancy declines from pre-pandemic levels than other countries (the first phase). Throughout 2021, mortality in these countries stabilised or declined, and life expectancy increased slightly compared to 2020 (the second phase). However, in Eastern and Central Europe, COVID-19-related mortality continued to increase, further deepening the fall in life expectancy. In Bulgaria in 2021, life expectancy dropped to 75.1 years for women and to 68.0 years for men.
It was during this second phase in 2021 that the differentiated life expectancy trends across Europe led to a widening of regional mortality disparities across the continent. Between 2019 and 2021, the gap in life expectancy at birth between Spanish and Bulgarian men grew by more than 30%, reaching 12.4 years. For women, this gap increased by more than 40% (but from a lower absolute level), with an absolute difference of 11.1 years. These figures are conservative estimates of regional inequality, given that Russia, Ukraine, and several other countries in Eastern and South-Eastern Europe had even lower life expectancy than Bulgaria (see the data table on the front side).
In 2022 (the recovery phase), life expectancy rose in most Eastern and Central European countries, and stabilised in areas with higher pre-pandemic life expectancy. Regional inequalities in Europe broadly returned to their pre-pandemic levels, albeit in a different context: all countries had lower life expectancy in 2022 than in 2019, with no clear evidence yet of life expectancy returning to pre-pandemic levels.
Life expectancy may not have fully recovered not only due to the ongoing effects of COVID-19 infections, but also due to the long-term indirect impacts of the pandemic, such as delays in health screenings and elective surgical procedures, deteriorated health, and demographic changes.
Outside of Europe, the trend in the United States was similar to that in some Eastern European countries, with life expectancy falling sharply in the first two phases of life expectancy change. Between 2019 and 2021, life expectancy dropped by about three years among males and by two and a half years among females. Despite recovering somewhat in 2022, it remained well below pre-pandemic levels.
Figures:
Figure: Trends in life expectancy by sex, 2015–2022

Bernhard Rengs
Since the start of the Russian war against Ukraine in 2022, millions of Ukrainians have been displaced internally or internationally. UNHCR data from June 2023 show that 5.1 million had fled within Ukraine (internally displaced people) and 5.9 million had fled to other countries, mainly in Europe. A particularly large share of Ukrainian refugees fled to neighbouring Poland, which in mid-2023 still hosted one million Ukrainian refugees. This is the second highest number after Germany (1.04 million) – when not taking Russia (1.3 million) into account. This figure represented 17% of all externally displaced Ukrainians and 2.7% of the total population of Poland.
In mid-2023, the other countries hosting the highest numbers of Ukrainian refugees were Czechia (349 thousand), the UK (213 thousand), Spain (178 thousand), Italy (165 thousand), and Bulgaria (161 thousand). But these absolute numbers do not fully reflect the challenges the host countries face, as the share of refugees per capita differs vastly between countries. While several smaller countries host a seemingly small number of Ukrainian refugees, they often make up a sizeable proportion of the total population. In relative terms, the countries with the highest numbers of Ukrainian refugees include Montenegro (6.8% of the total population), Moldova (4.3%), and Czechia (3.2%), as well as the Baltic states of Estonia (2.8%), Lithuania (2.4%), and Latvia (2.3%).
Data on net in-migration of Ukrainians into European countries in 2022 can be used to reconstruct their age and sex structure. The figure shows that the population of recent migrants from Ukraine is heavily skewed towards adult women (aged 20 and older) and younger age groups of both girls and boys. This reflects the fact that the majority of Ukrainian refugees are women – mothers and grandmothers – with children. Men make up only a quarter of the adult refugees hosted in Europe.
The recent migration wave from Ukraine to Europe is the biggest since around 2015, when large numbers of refugees from West Asia and Africa, especially from Syria and Afghanistan, came to Europe. As many conflicts have not been resolved and new crises have arisen since then, in mid-2023, there were 9.3 million non-Ukrainian refugees in Europe, registered mostly in Türkiye (3.6 million), Germany (1.8 million), and France (643 thousand).
For various, mainly economic and political reasons, but also due to the proximity to Ukraine of countries that were not typical refugee migration destinations in the past, there are only five European countries in which both Ukrainian refugees and non-Ukrainian refugees make up more than 1% of the total population. These countries are Latvia (12.3% of the population are refugees), Estonia (7.8%), Cyprus (7.6%), Austria (3.5%), and Germany (3.4%). Other countries also have large shares of refugees, like Montenegro (6.9%), Moldova (4.5%), and Türkiye (4.3%), but the refugees mainly come from either Ukraine or other countries.
Figures:
Figure: Ukrainian refugees in Europe by age and sex, 2023

Anne Goujon and Philipp Ueffing
The Russian invasion of Ukraine in February 2022 forced millions of Ukrainians to leave their homes. This exodus was the most abrupt and extensive population displacement that has taken place in Europe since World War II (see Box on Refugees in Europe). Among Ukrainian migrants, the majority fled to the European Union countries where they benefited from the Temporary Protection Directive (TPD). The TPD, which was activated by the European Commission one week after the start of the war, gave the displaced Ukrainians immediate access to the labour market, education, healthcare, and accommodation.
The current wave of forced migration has dramatically accelerated the long-standing population decline attributable to low birth rates, coupled with relatively high mortality and emigration rates, which Ukraine has been grappling with since gaining independence in 1991.
A report published in collaboration with the European Commission Joint Research Centre (JRC) illustrates how the forced displacement and long-term migration patterns of Ukrainians are likely to impact the country’s population size up to 2052. The researchers developed four hypothetical scenarios with different assumptions about the extent of the refugee movement caused by the war, return migration in the context of future recovery and reconstruction, and a set of longer-term migration trends. The narratives of the scenarios try to capture a wide, yet plausible range of possible futures, from a pessimistic scenario of a longer war and a slow economic recovery following the war to an optimistic scenario of a shorter war and a swift post-war recovery bringing long-term social and political stability and economic growth. These scenarios should be interpreted as tools for discussing future alternatives to improve policy preparedness, rather than as accurate forecasts of the future.
The figure depicts the projected size of the Ukraine population depending on the international displacement, return migration, and longer-term migration trends from 2022 to 2052. These four scenarios are compared with the UN median variant (yellow solid line) and with a hypothetical “no war” projection with both displacement and migration set to zero (dotted line). In all four scenarios, the population of Ukraine is projected to further decline. In the most pessimistic scenario, which foresees a long war and a low number of Ukrainian nationals returning after the war, the population is projected to decline by 31% by 2052, from 43.3 million in early 2022 to 29.9 million in 2052. Even in the most optimistic scenario in which Ukraine recovers quickly and experiences more inward than outward migration, the population is projected to decline by 21% (to 34.3 million in 2052). The study indicates that the war and the resulting displacement will exacerbate population decline and ageing in Ukraine, and will lead to drastic changes in the population structure, particularly among the younger age groups. Between 2022 and 2052, the population under age 20 is projected to decline by 35% in the most optimistic scenario, and by 43% in the most pessimistic “long war, low return” scenario.
Figures:
Figure: Population of Ukraine until 2052 (different scenarios)
References:
Ueffing, P., Adhikari, S., K.C., S., Poznyak, O., Goujon, A. and Natale, F. 2023. Ukraine's population future after the Russian Invasion. Publications Office of the European Union, Luxembourg. DOI: 10.2760/607962
https://pure.iiasa.ac.at/18667, https://publications.jrc.ec.europa.eu/repository/handle/JRC132458
United Nations, Department of Economic and Social Affairs Population Division. 2022. World Population Prospects 2022, online edition (graphs data for 2007–2020)

Anne Goujon
In 2023, the global population and education projections by the Wittgenstein Centre underwent a major update, building on the groundwork laid in 2013, as detailed in the “World Population and Human Capital in the Twenty-First Century”, and an update published in 2018 in collaboration with the European Commission Joint Research Centre.
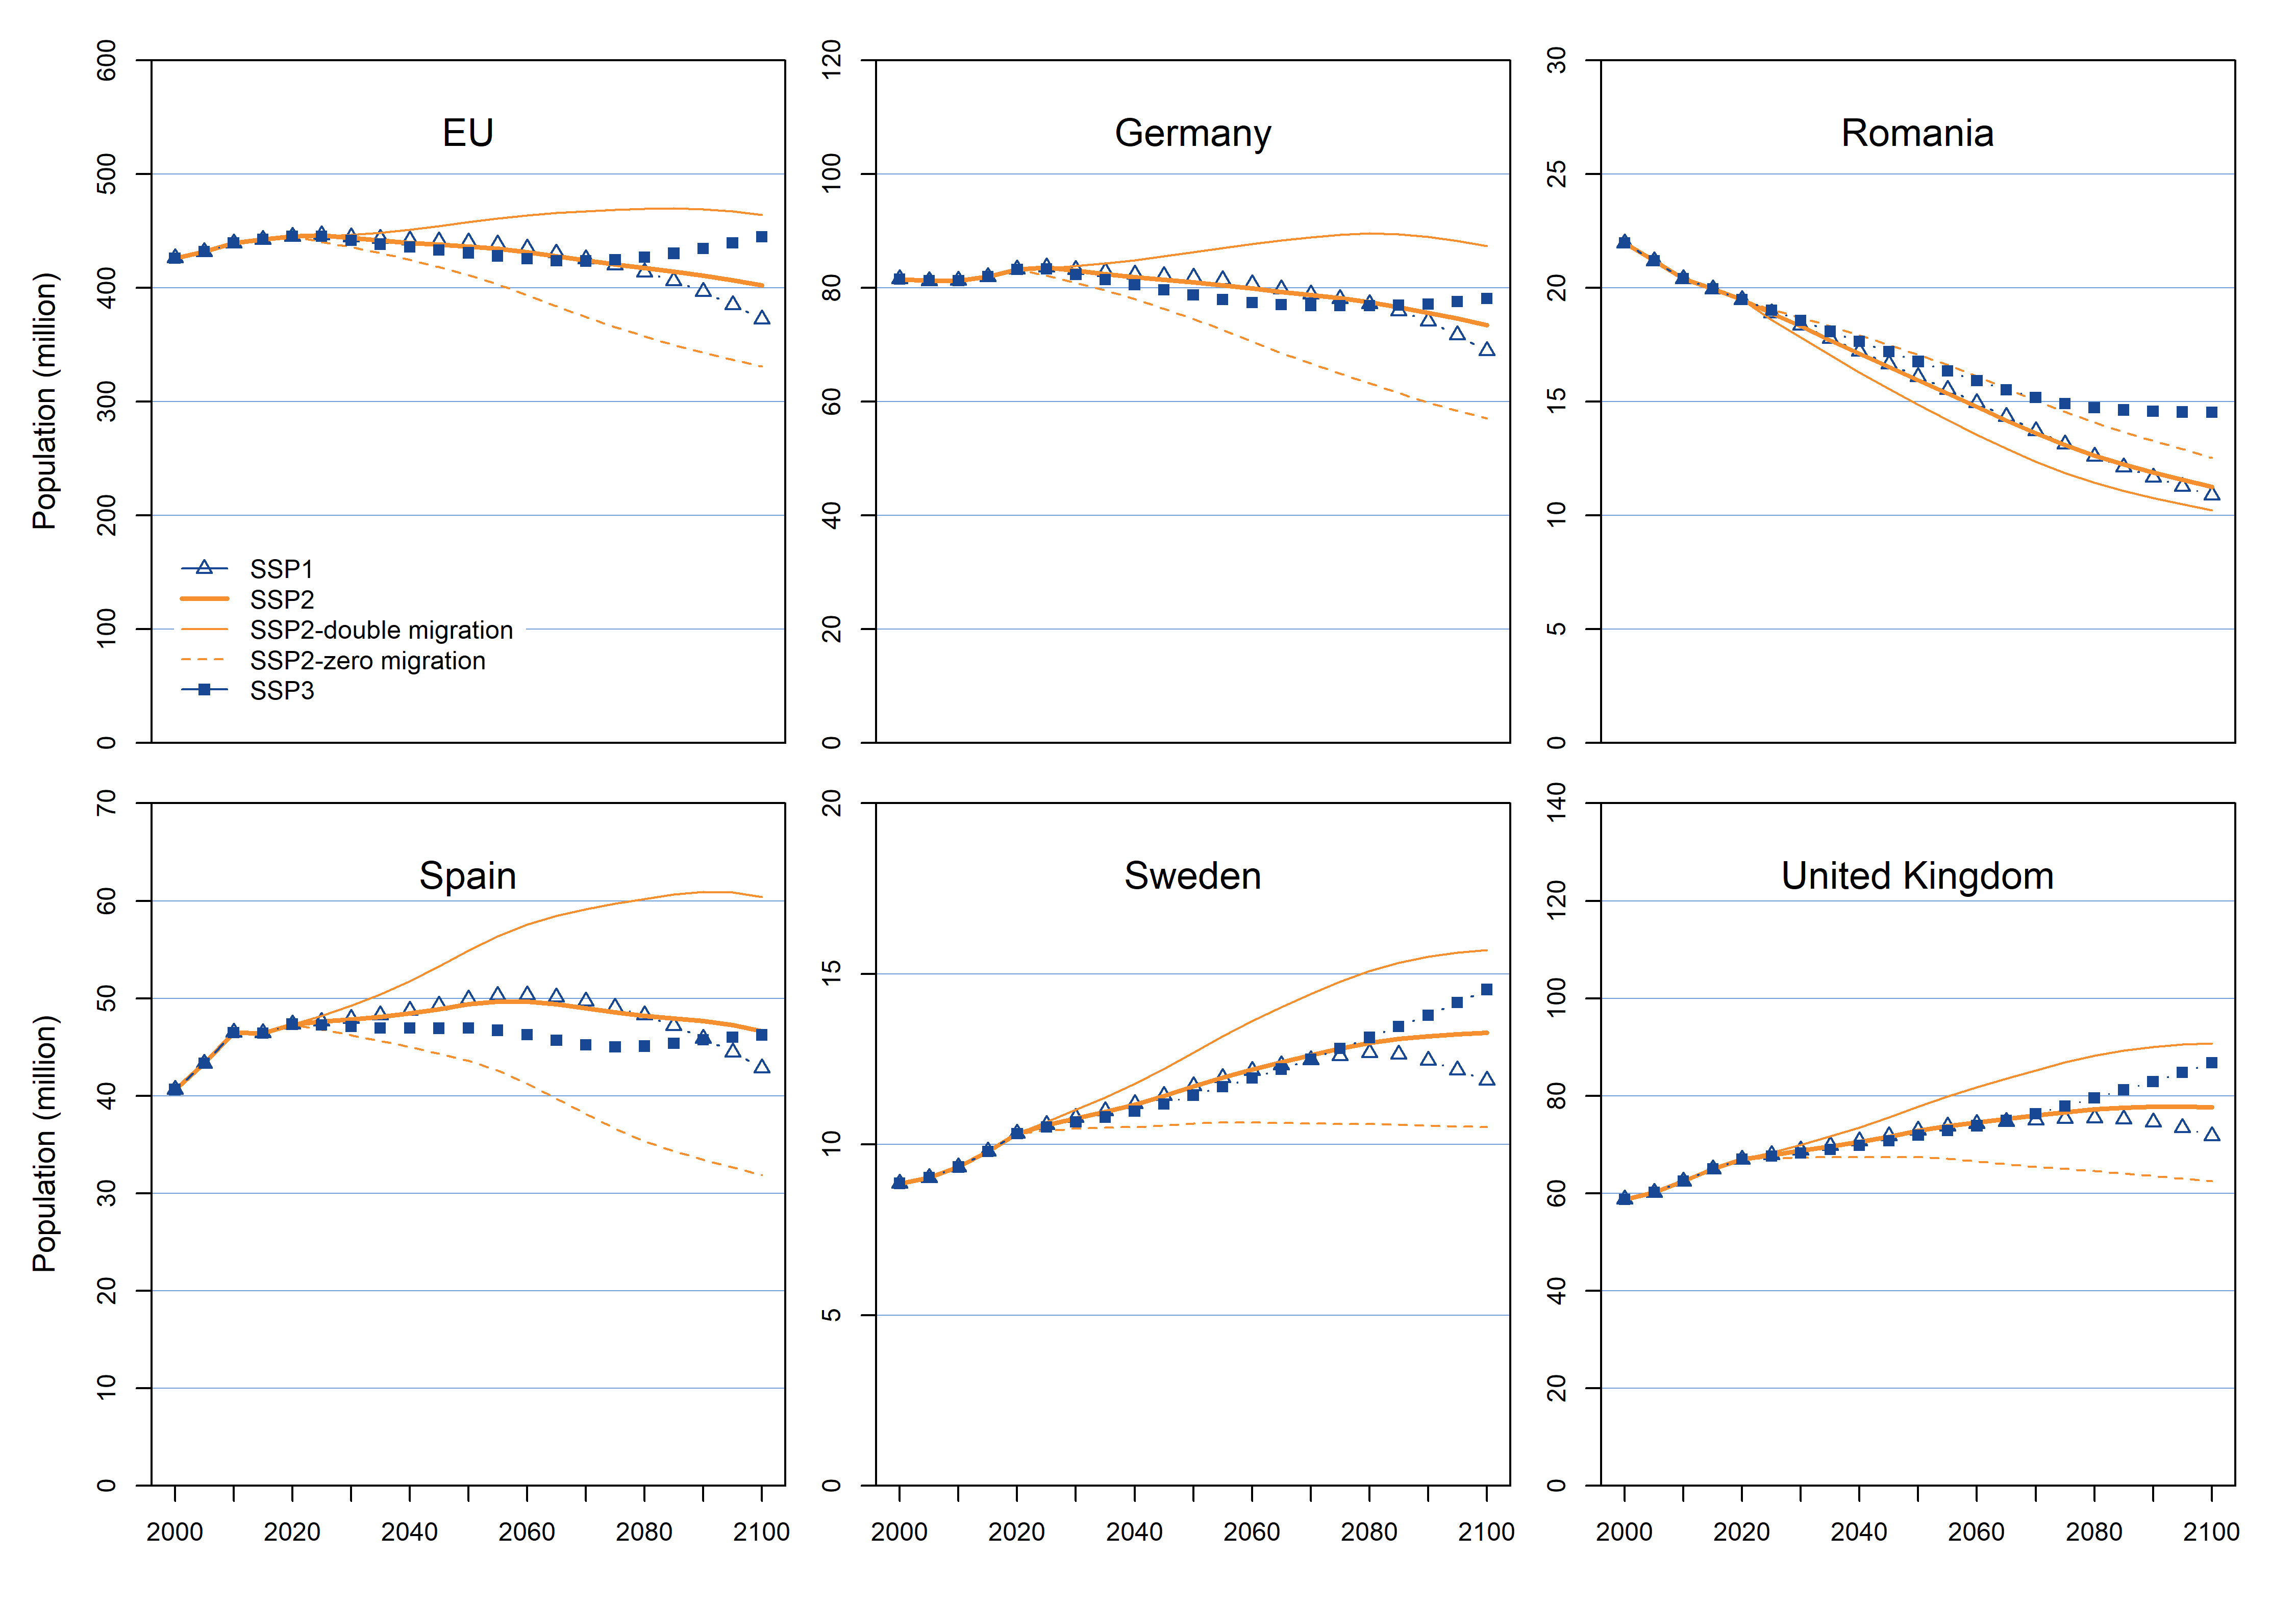
This latest projection round follows the narratives of the five Shared Socioeconomic Pathways (SSPs), using 2020 as the reference year, and adjusting short-term assumptions until 2030. The modelling approaches for fertility, mortality, and education have been modified, introducing updates to education-specific fertility rates and country- and education-specific mortality rates. Explicit education-specific migration differentials are also introduced. All changes are documented in a study by KC et al. (2024). Data are available for 200 countries across age, sex, and education levels for seven scenarios: SSP1 to 5, and SSP2 – the middle of the road scenario – combined with zero net migration and double net migration.
According to the SSP2 scenario, global population will peak at 10.13 billion in 2080, gradually declining to 9.88 billion by 2100. Under the same scenario, the population of the European Union will remain relatively stable, slowly declining from 445 million in 2020 to 402 million by the end of the century. Migration emerges as a pivotal factor. Under SSP2 with medium fertility and mortality but double net migration across 27 countries, the EU population is projected to increase to 464 million in 2100. Conversely, setting net migration to zero leads to the EU population declining to 331 million by the century's end. The high and low fertility and mortality scenarios envisaged in SSP1 and SSP3 have minimal impact up to 2080, but follow diverging paths in the last 20 years of the projection exercise.
For individual European countries, particularly for Germany and Spain, the overall picture broadly aligns with the EU population dynamics. For Romania, which has experienced substantial outmigration in recent decades, population decline is anticipated in all scenarios. In the SSP2 medium scenario, Romania's population is projected to be 42% lower in 2100, but 48% lower with double migration and 36% lower with zero migration. For Sweden and to a lesser extent the United Kingdom, almost all scenarios show an increase in the population (by +29% and +16%, respectively, under the SSP2 scenario), mostly due to the assumption of relatively high fertility in both countries. For most countries, including countries with a long history of low fertility such as Germany and Spain, double net migration would lead to continuing population growth until the last decades of this century.
For more information, see KC et al. 2024. The updated data and graphics are available in the Wittgenstein Centre Data Explorer at https://dataexplorer.wittgensteincentre.org/wcde-v3/ (beta version) and in Zenodo (v.13) https://zenodo.org/records/10618931.
References
Lutz, W., Butz, W.P. and KC, S. 2014 (eds). World Population and Human Capital in the Twenty-First Century. Oxford University Press, ISBN: 9780198703167.
Lutz, W., Goujon, A., Kc, S., Stonawski, M. and Stilianakis, N. 2018. Demographic and Human Capital Scenarios for the 21st Century: 2018 assessment for 201 countries. Publications Office of the European Union, Luxembourg, 2018. doi:10.2760/835878. https://publications.jrc.ec.europa.eu/repository/handle/JRC111148
K.C., S., Dhakad, M., Potančoková, M., Adhikari, S., Yildiz, D., Mamolo, M., Sobotka, T., Zeman, K., Abel, G., Lutz, W. and Goujon, A. 2024. Updating the Shared Socioeconomic Pathways (SSPs) Global Population and Human Capital Projections. IIASA Working Paper. Laxenburg, Austria: WP-24-003. https://pure.iiasa.ac.at/id/eprint/19487/
United Nations, Department of Economic and Social Affairs, Population Division. 2022. World Population Prospects 2022, online edition (graphs data for 2000–2020)
Figures:
Figure: Total population in the European Union and selected countries, 2000–2100, different scenarios

Michaela Potančoková, Jakub Bijak and Guillaume Marois
Current expectations of future migration will most likely prove incorrect over the longer term due to the unpredictability of the underlying drivers of migration, including wars, natural catastrophes, and economic and geopolitical shifts. To address the randomness of future migration estimates in population projections, Bijak (2023) proposed a novel framework based on the modelling of rare migration events, anchored in the statistical theory of extreme values. Our approach focuses on the volatility of international migration caused by unpredictable crises and the resulting disturbances to the migration systems and shifts in migration trends.
As an illustration, we simulate alternative scenarios of hypothetical large increases in immigration to Europe from different world regions (Potančoková et al. 2023). The scenarios are simulated sequentially and initiated at identical time points to better understand their individual demographic and labour market impacts.
The examples in the figure illustrate persistent high-migration events scenarios (PHME). These scenarios simulate large immigration flows persisting over an extended period: after the initial high-migration event, immigration from a given region only gradually returns to the volumes envisaged in the baseline scenario a decade later. Migrant networks and past migration corridors are used in the simulation to approximate the choice of destination country. Therefore, events in the origin regions previously linked to a particular destination country affect the size and the composition of that country’s population.
The figure shows the impacts of PHME scenarios on three European countries up to 2060 and their divergent demographic futures. In Spain, only migration events from Latin America would leave a sizeable imprint on the projected population and total labour force. However, in line with previous research, much higher immigration levels than those in our scenarios would be needed to slow the long-term labour force decline in Spain, without further improvements in migrant labour force integration. In contrast, the total population and the total labour force are projected to increase in the United Kingdom, where migration events from South & South-East Asia would be most impactful. In Germany, only events from Other Europe (Eastern Europe and Türkiye) and West Asia (Middle East) would increase the projected population and labour force. Both impactful scenarios would result in more sustained population growth and smaller reductions in the projected total labour force than in the baseline scenario. Results for more countries and scenarios are available at bit.ly/quantmig-scenarios
References
Bijak, J. 2023. European migration scenarios with probabilistic uncertainty assessment. QuantMig Project Deliverable 9.4. University of Southampton.
Potančoková, M., Marois, G., and González-Leonardo, M. 2023. Discussion paper: Demographic and labour force implications of high immigration events scenarios. IIASA Report. Laxenburg: IIASA.
Figures:
Figure: Projected relative change in total population and total labour force, 2020-2060, selected scenarios.