
European Demographic Datasheet 2026
Explore, visualize and compare population indicators for 45 European countries and regions.
Kryštof Zeman
Change in total fertility rate
Total fertility rate (TFR) is the average number of children that would be born alive to a woman during her lifetime if the age-specific fertility rates of a given year remained constant during her childbearing years. It is computed as the sum of fertility rates by age across all childbearing. Change in the total fertility rate is calculated as the difference between TFR in 2019 and 2024. Source: EUROSTAT (2026), National Statistical Organisations.
Richard Gisser
Excess deaths
Excess deaths in 2020–2023 are estimated as observed minus expected deaths in % of expected deaths. Expected deaths for 2020–2023 are ex-ante projected deaths from Eurostat (EUROPOP 2019) for EU/EFTA countries, ONS (2019) for the UK, and UN WPP (2019) for USA and Japan. Observed deaths are taken from EUROSTAT Database (2026) and from HMD (2026).
Figures:
Figure 1: Change in total fertility rate between 2019 and 2024
Figure 2: Excess deaths in 2020-2023 (observed minus expected deaths in %)
References:
EUROPOP 2019. Population projections at national level (2019-2100). EUROSTAT. https://ec.europa.eu/eurostat/databrowser/view/proj_19ndbi__custom_16141730/default/table
ONS 2019. Office for National Statistics 2019. National population projections: 2018-based. https://www.ons.gov.uk/peoplepopulationandcommunity/populationandmigration/populationprojections/bulletins/nationalpopulationprojections/2018based
UN WPP 2019: United Nations World Population Prospects 2019. https://www.un.org/development/desa/pd/news/world-population-prospects-2019-0
HMD: Human Mortality Database. Max Planck Institute for Demographic Research (Germany), University of California, Berkeley (USA), and French Institute for Demographic Studies (France). https://www.mortality.org
EUROSTAT Database, European Commission 2026.
https://ec.europa.eu/eurostat/data/database
Tomáš Sobotka and Kryštof Zeman
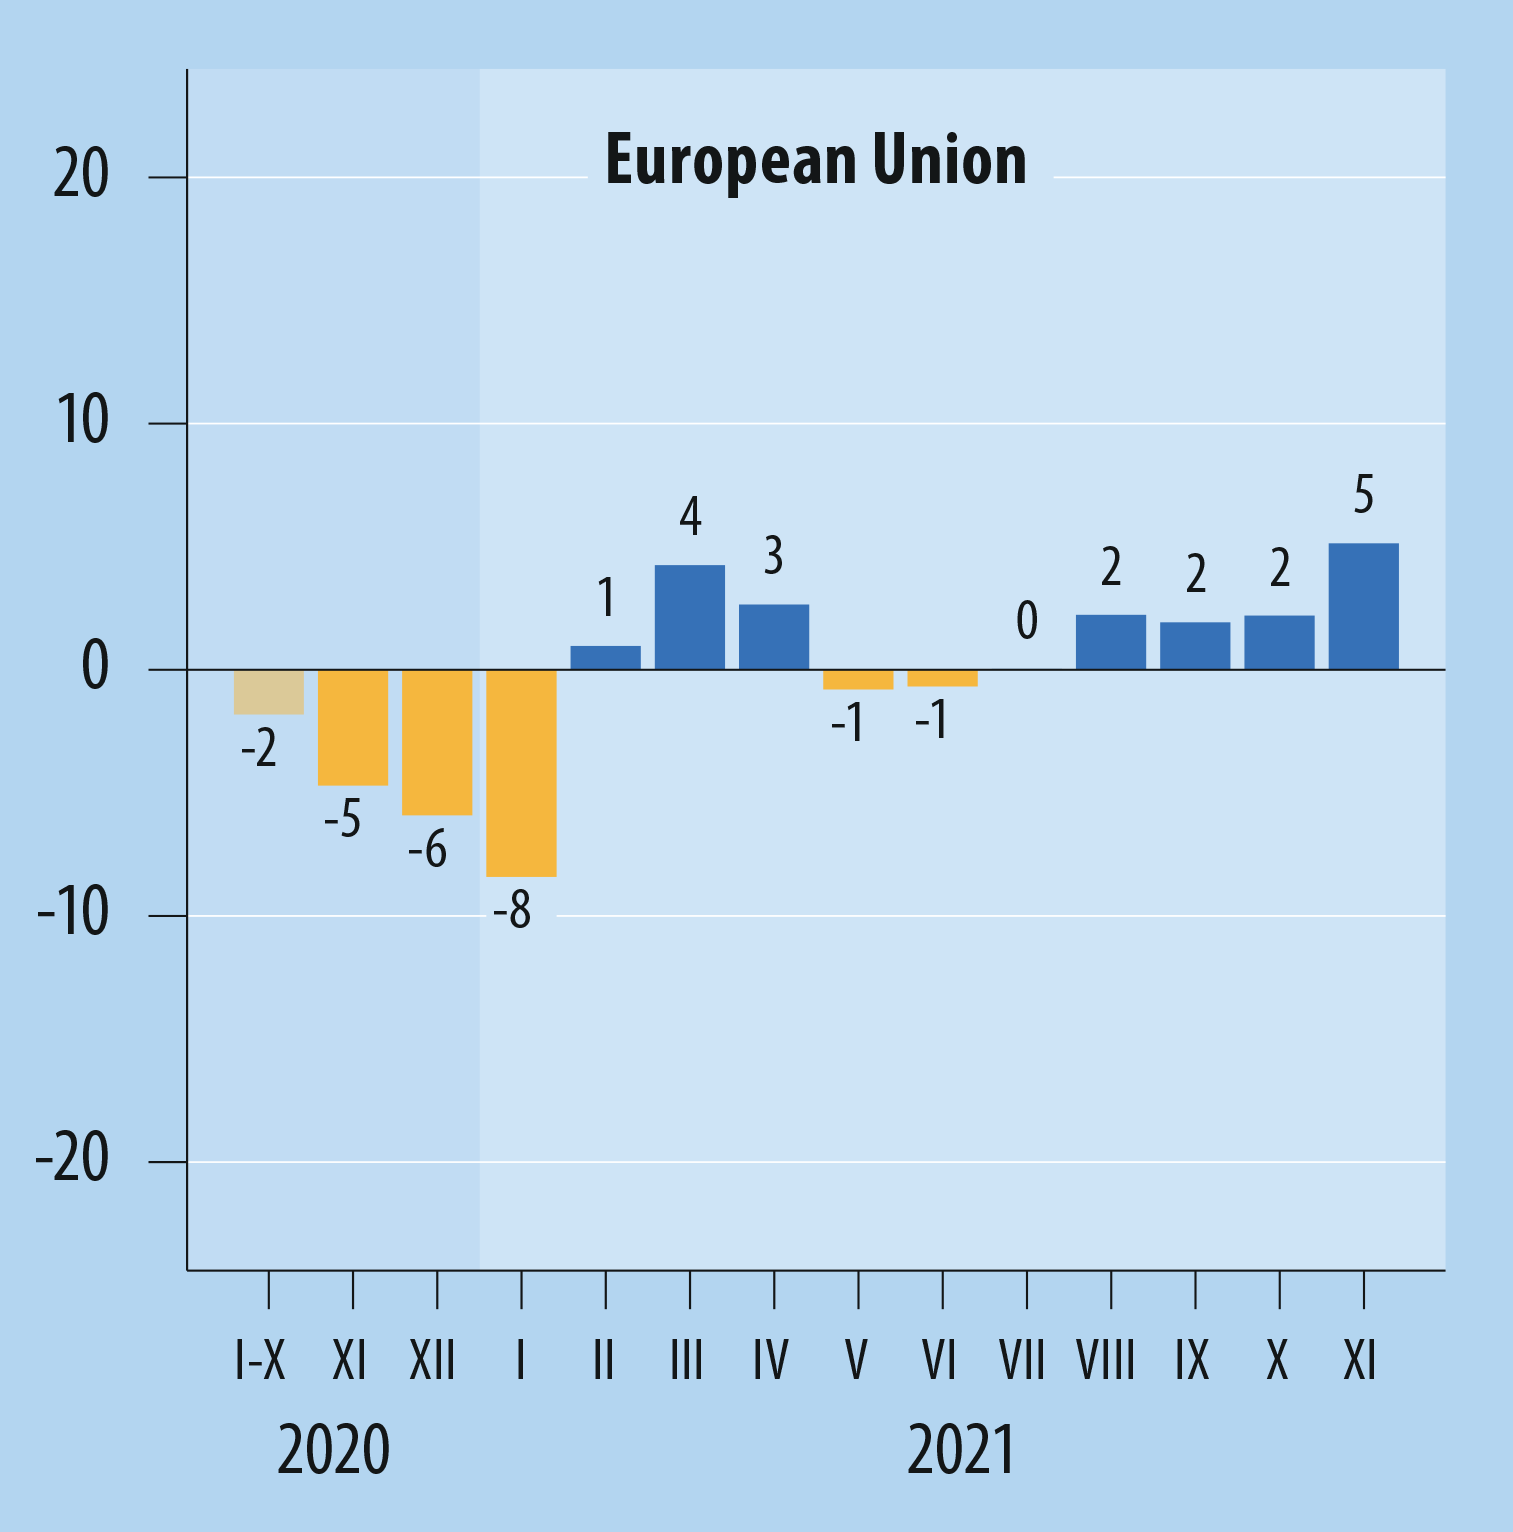
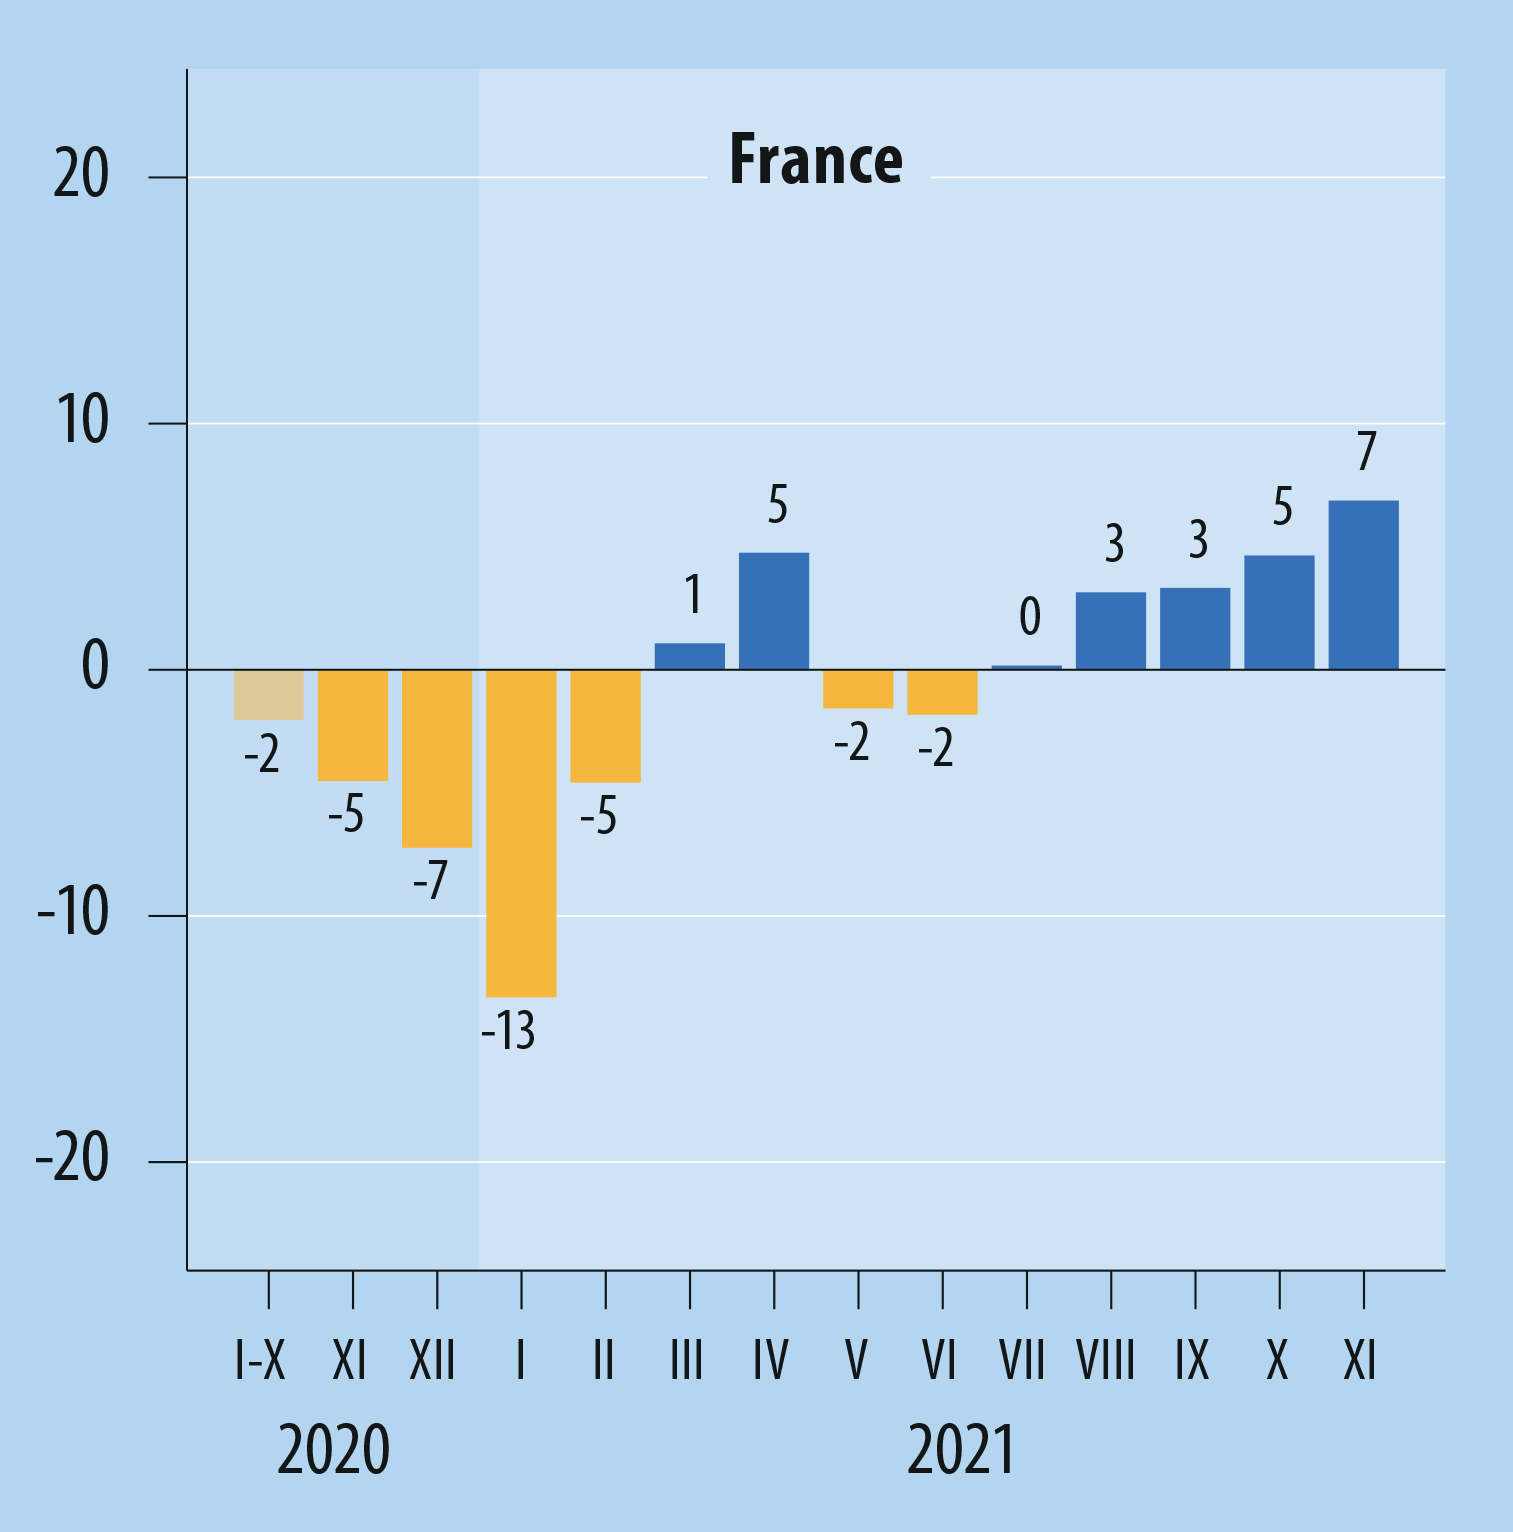
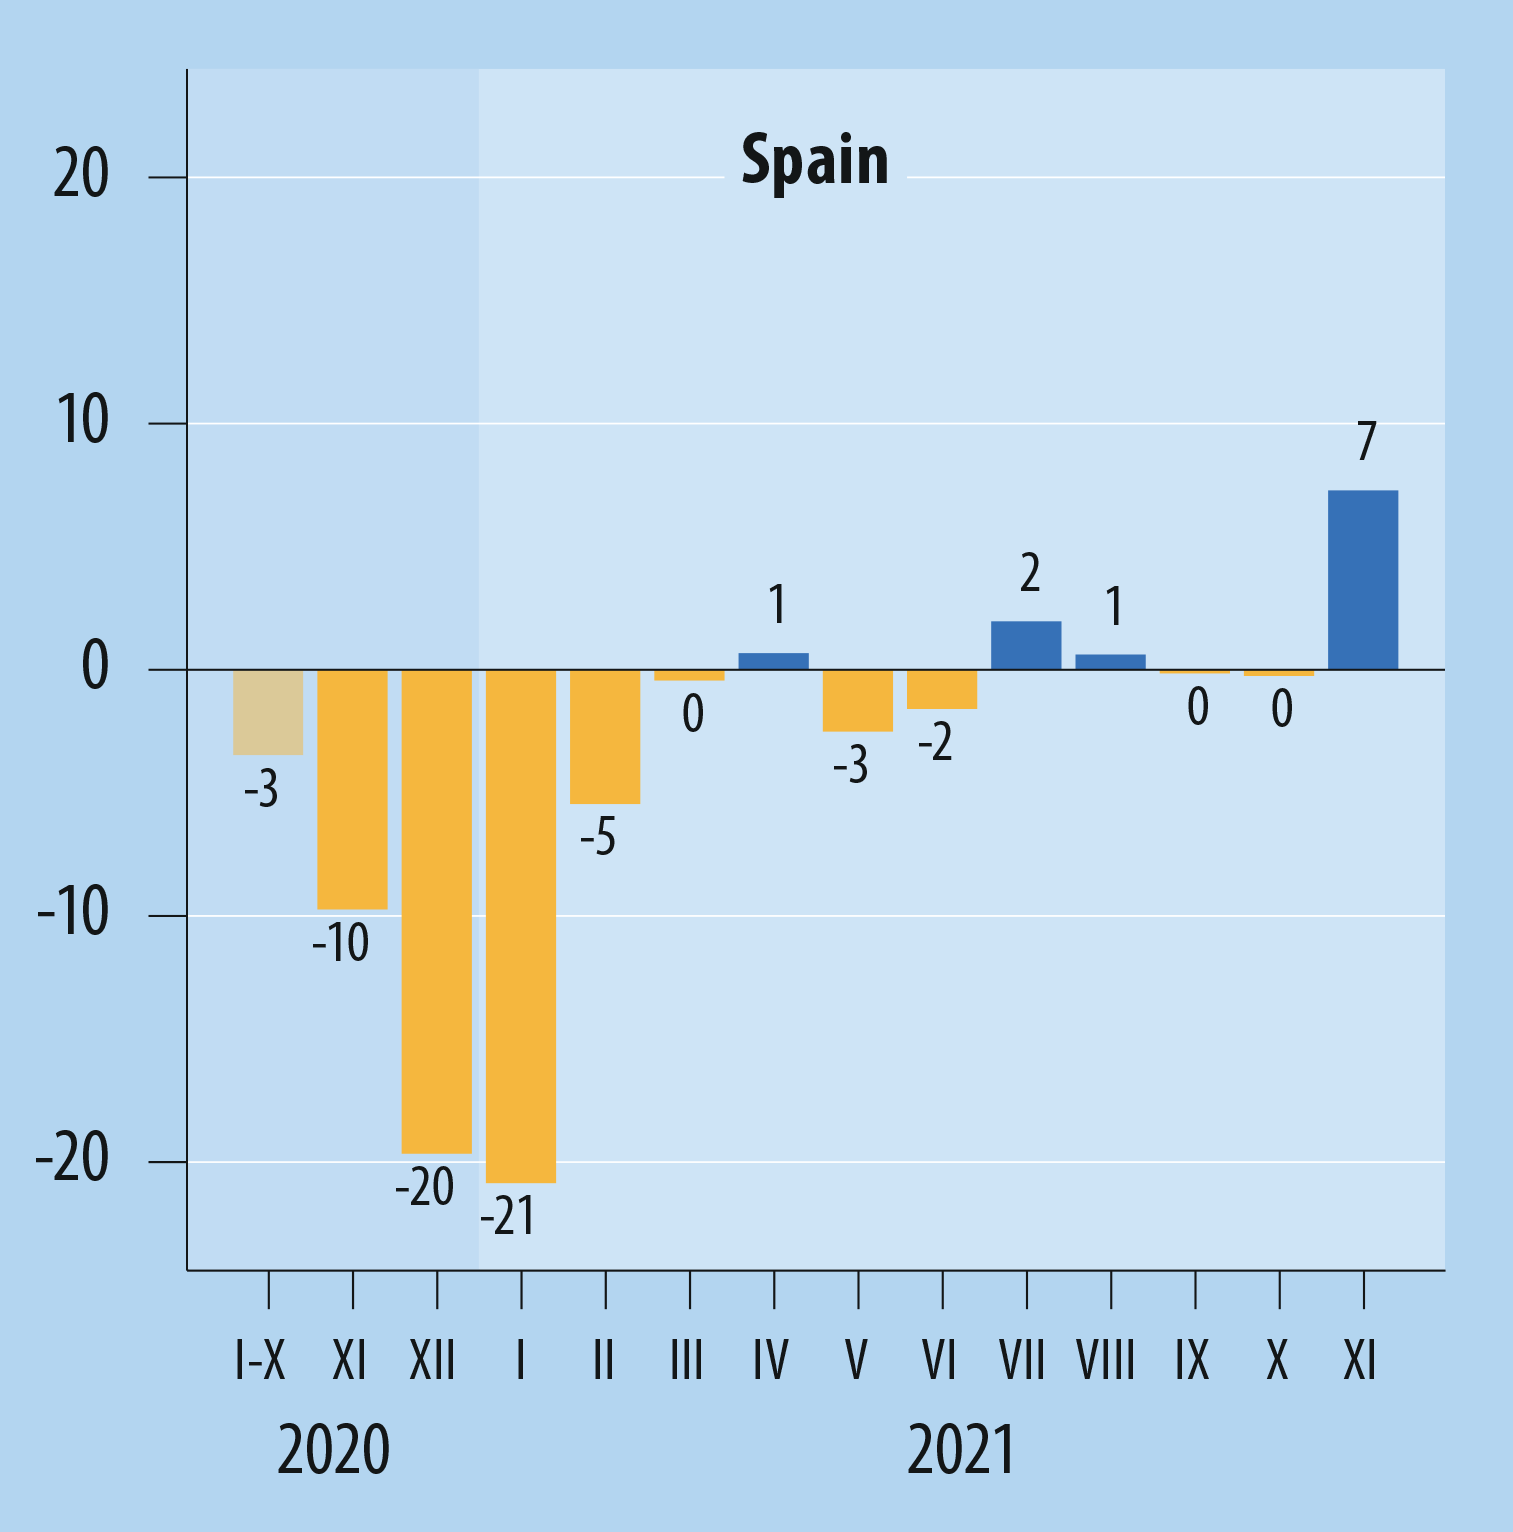
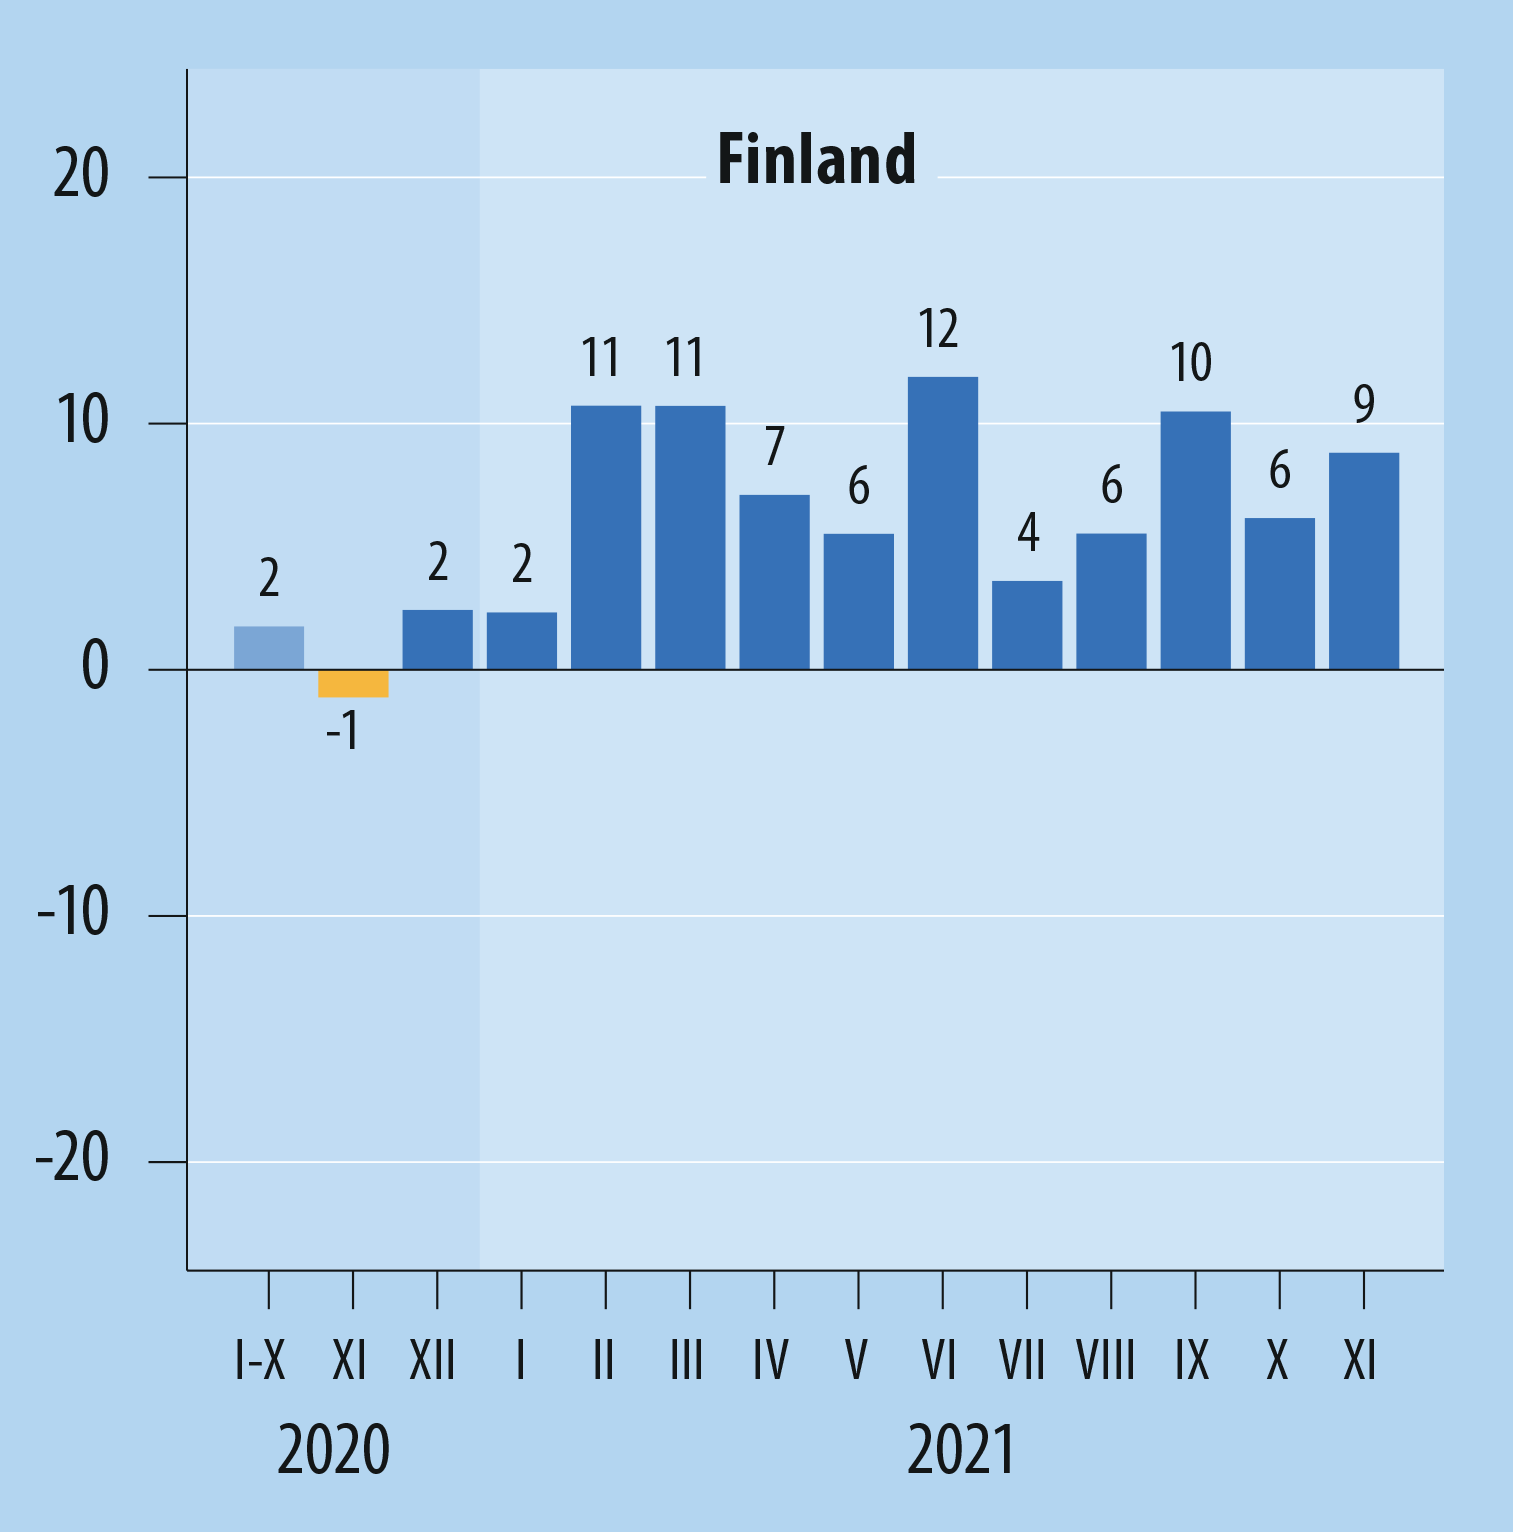
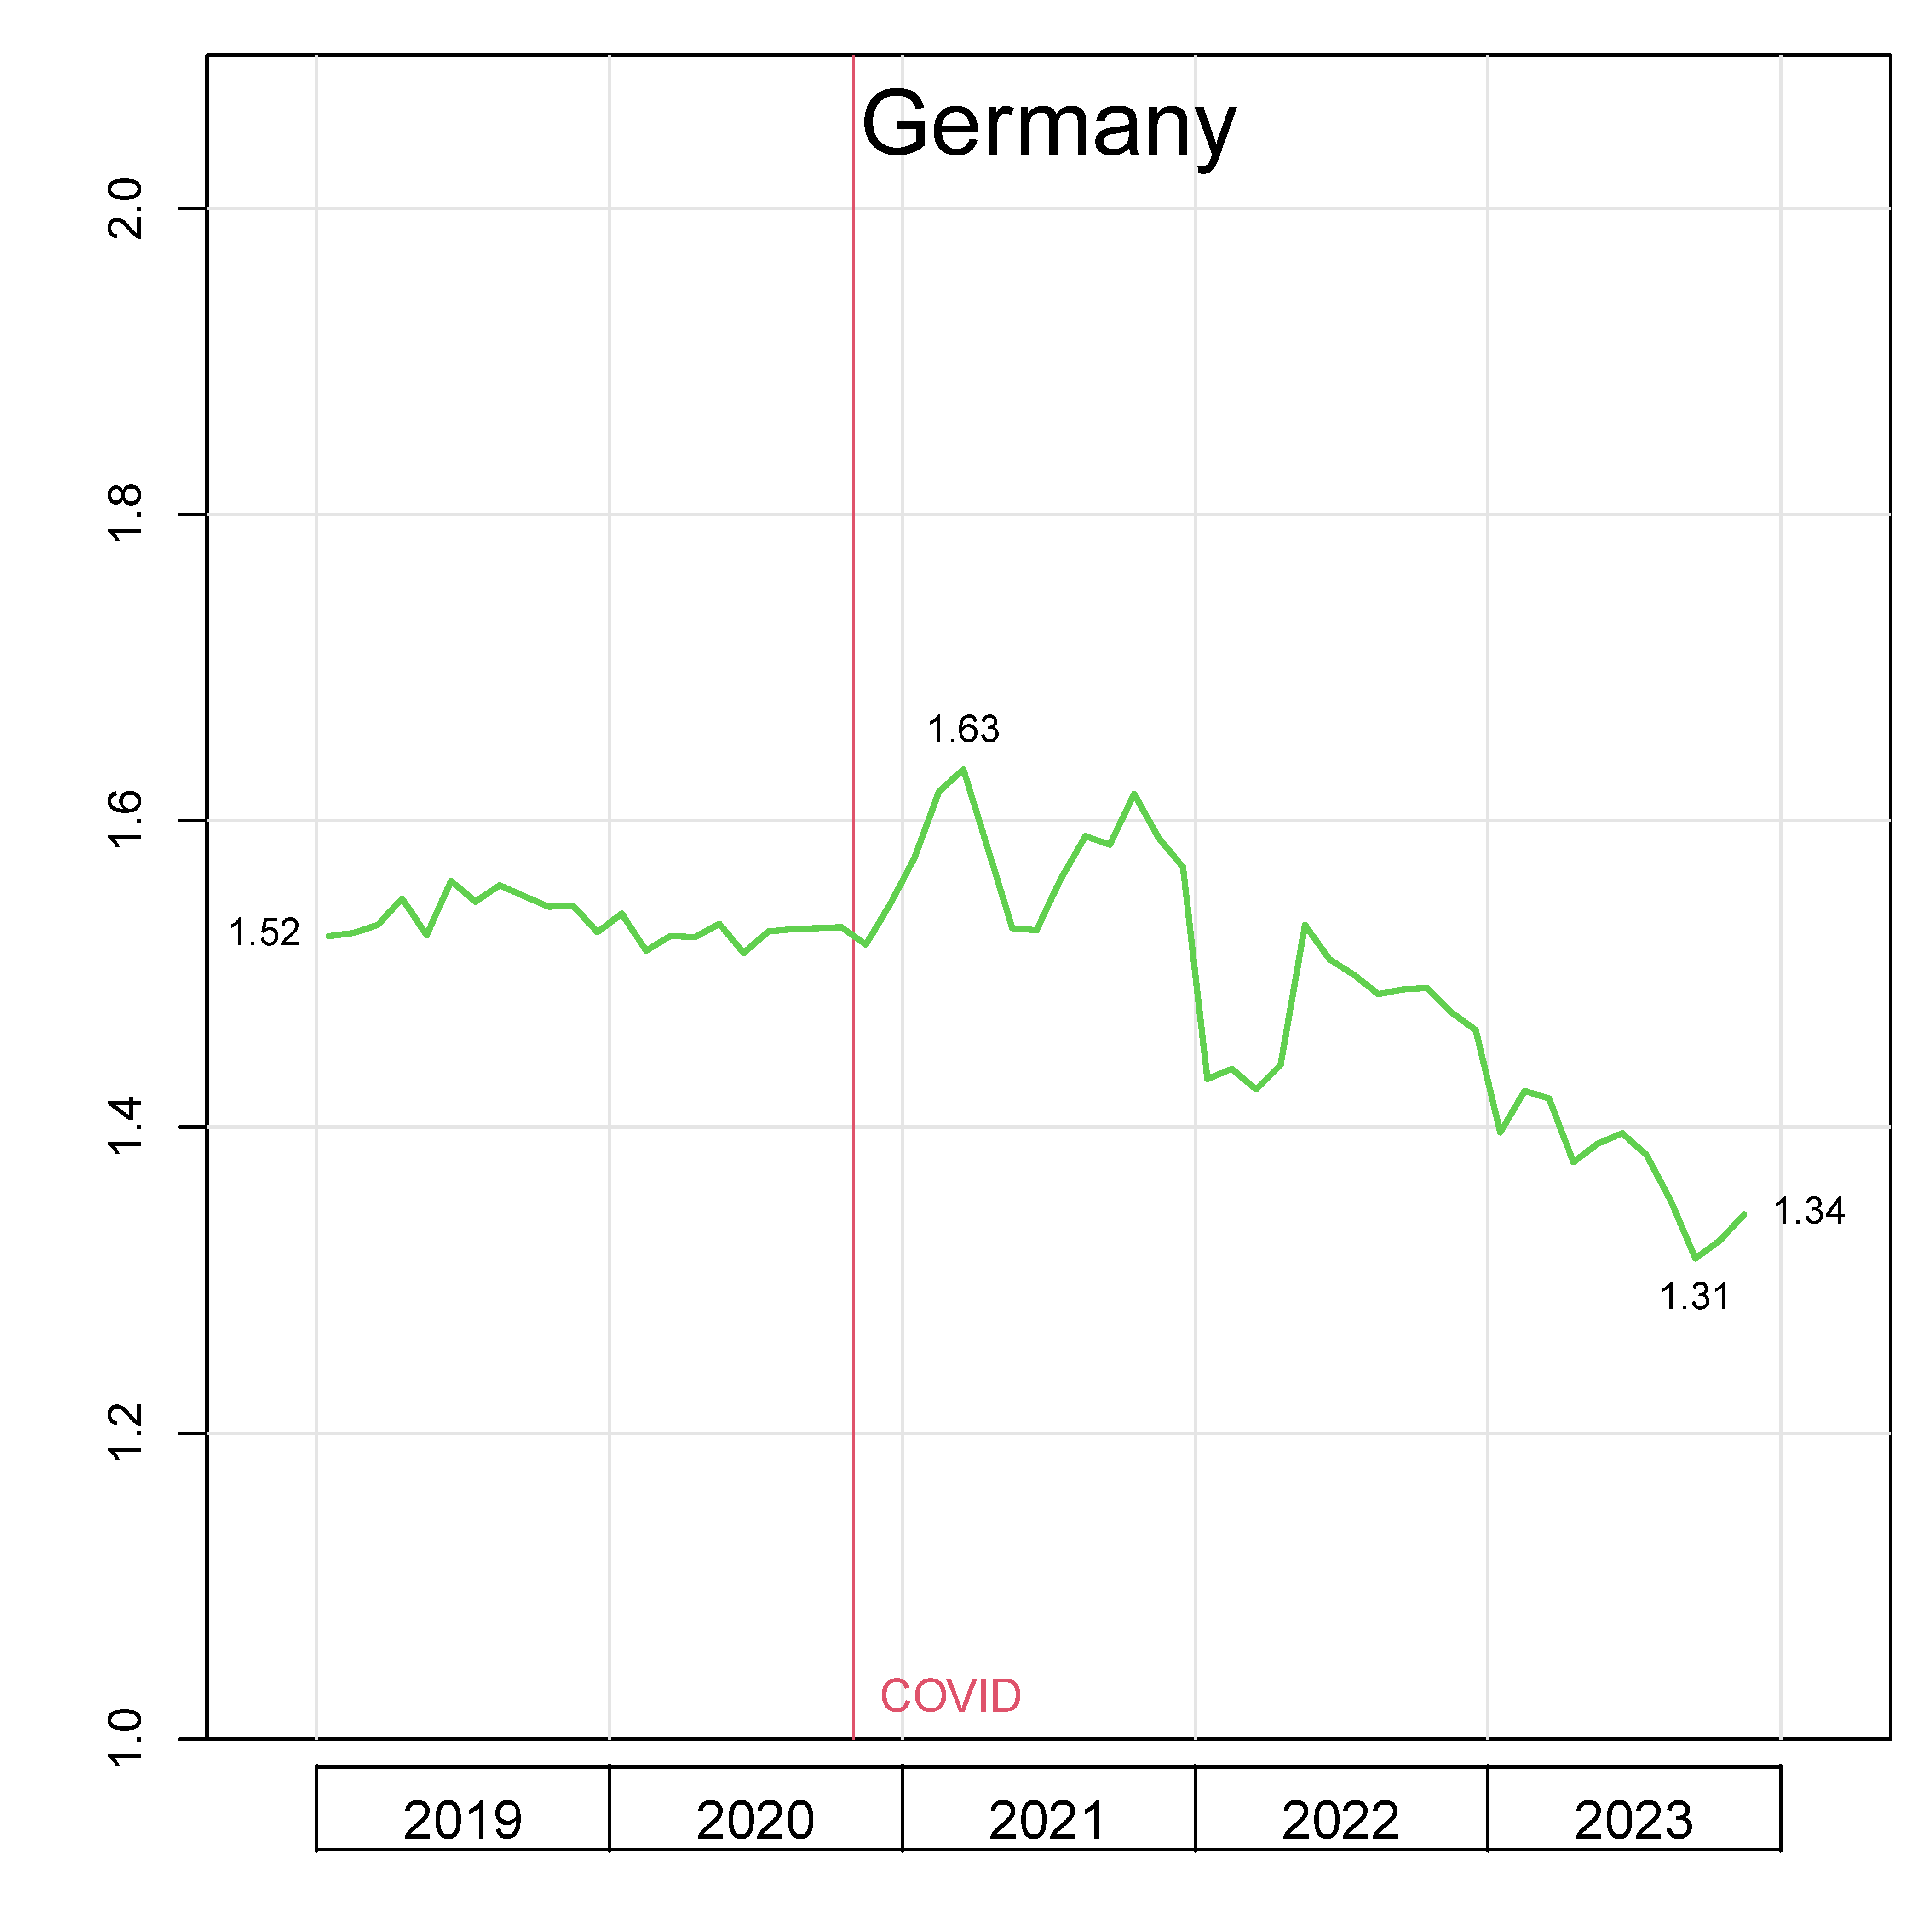
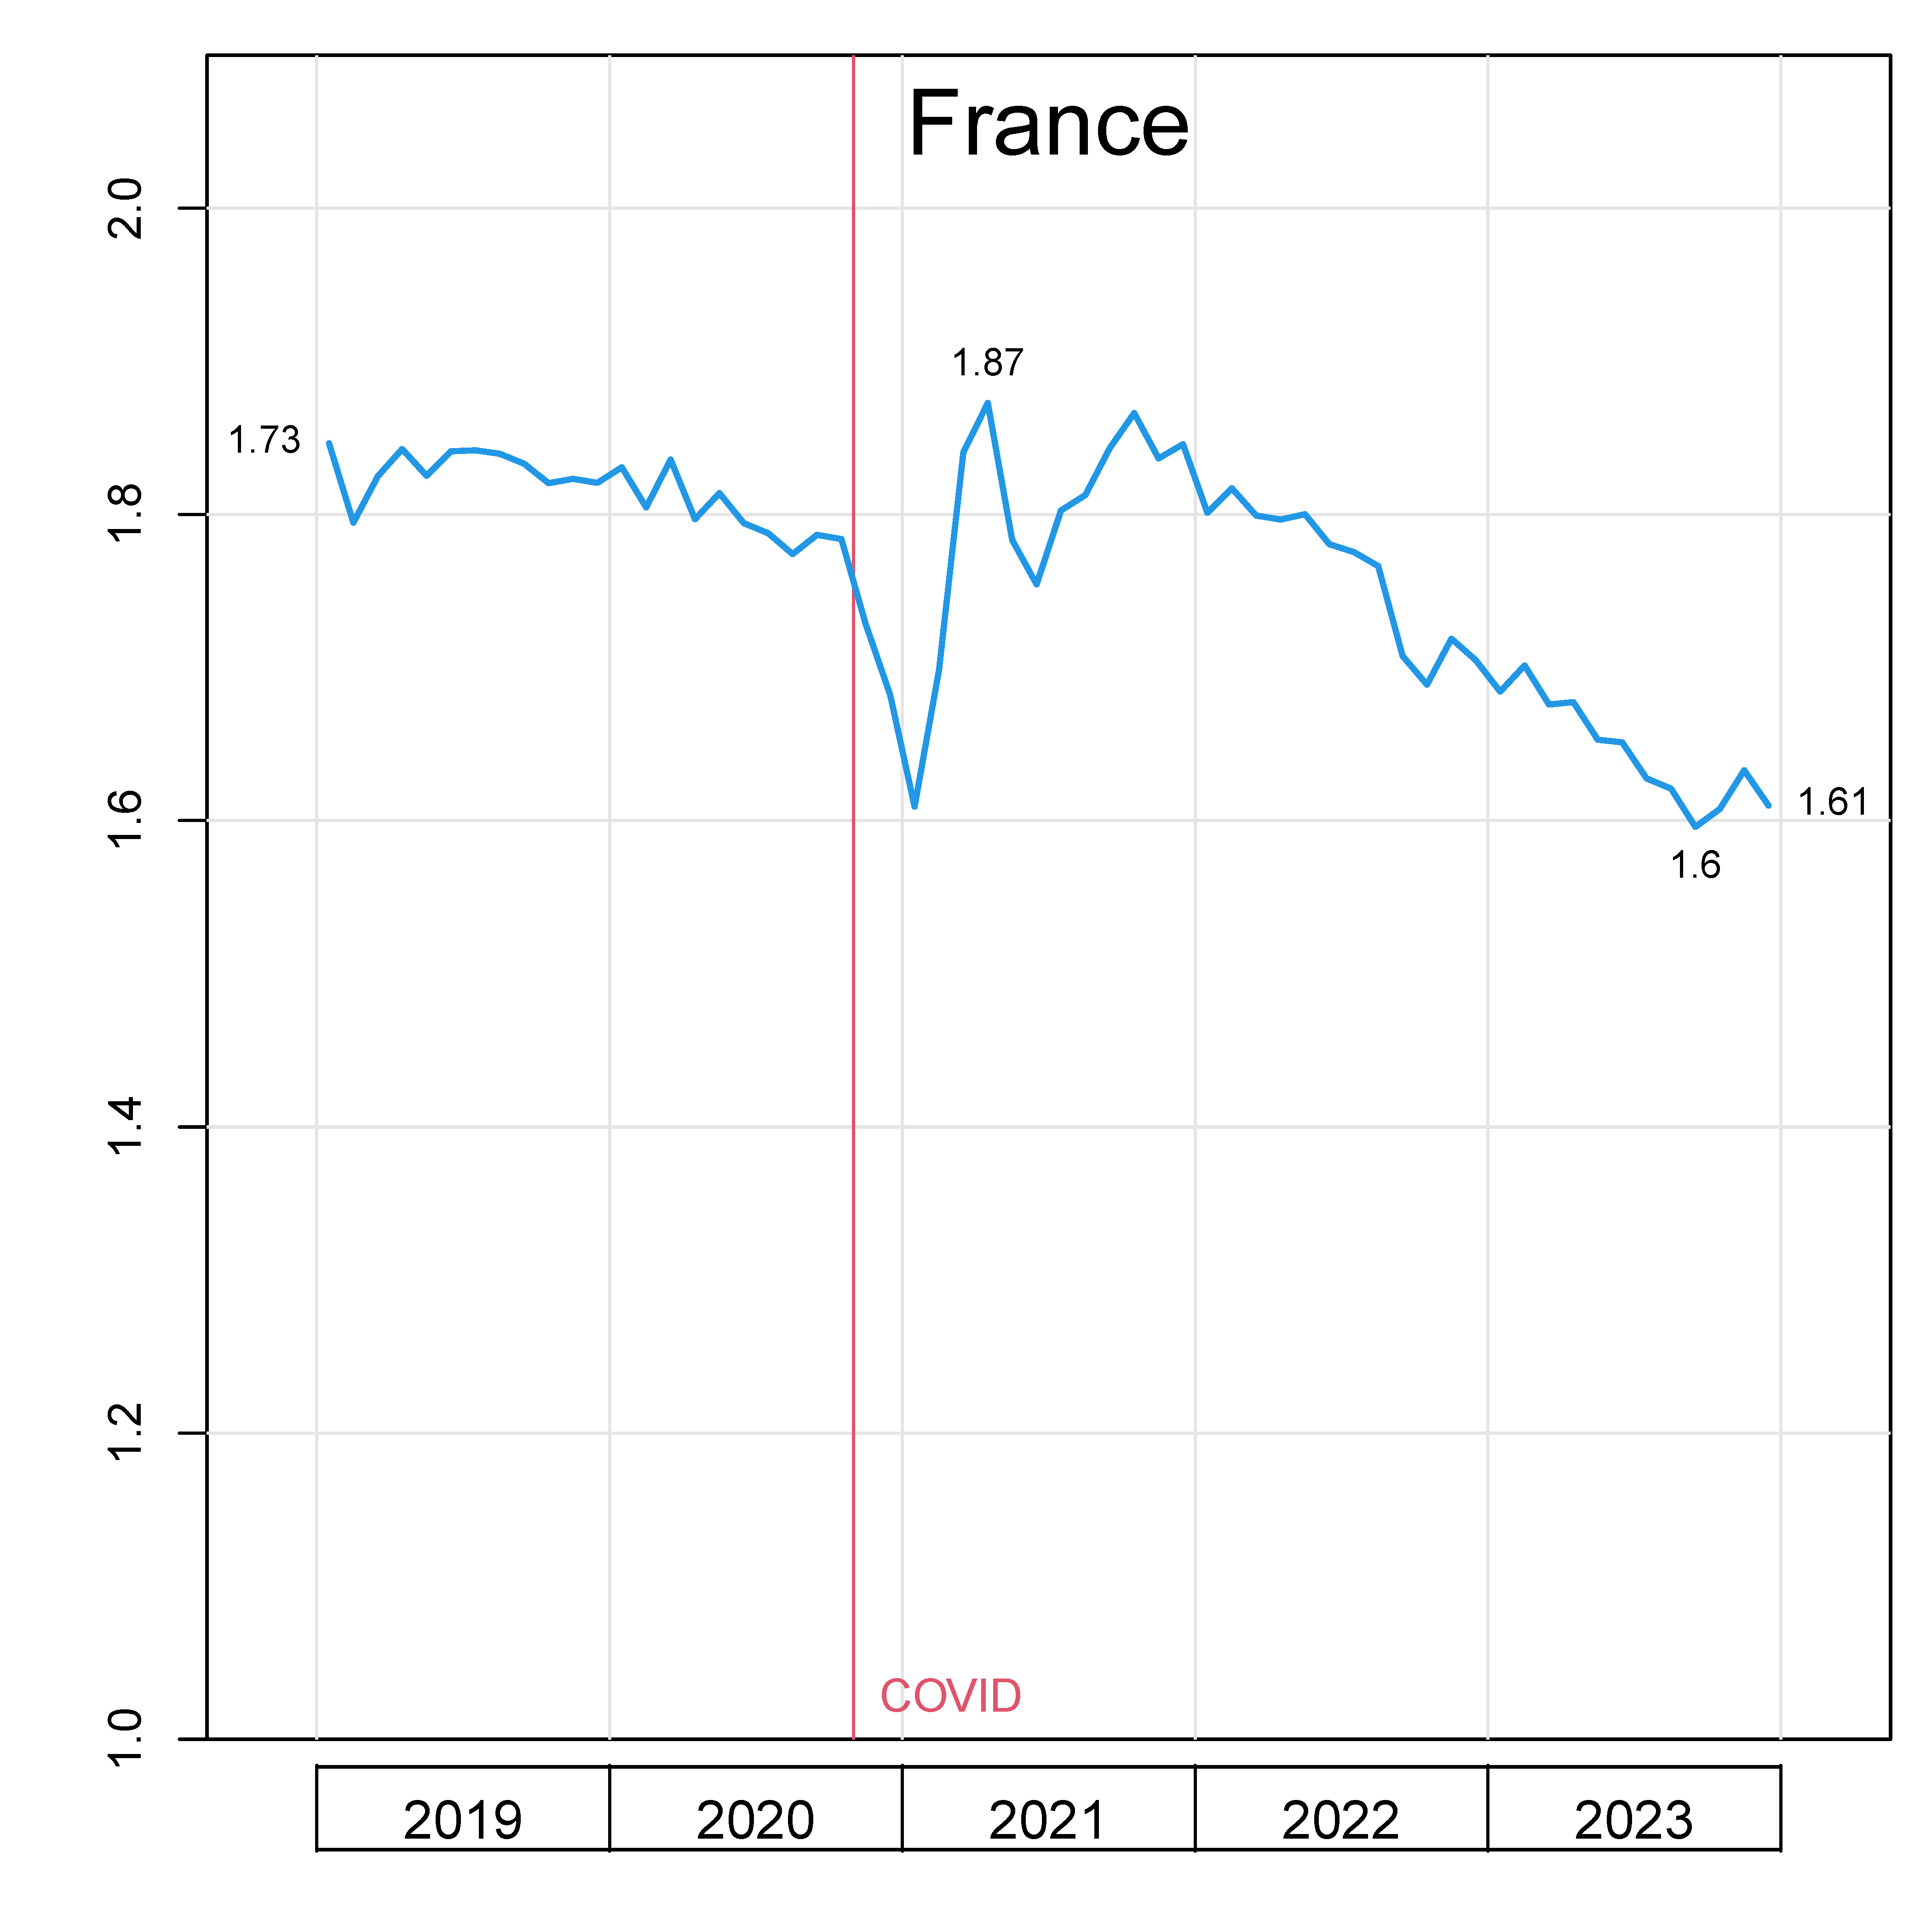
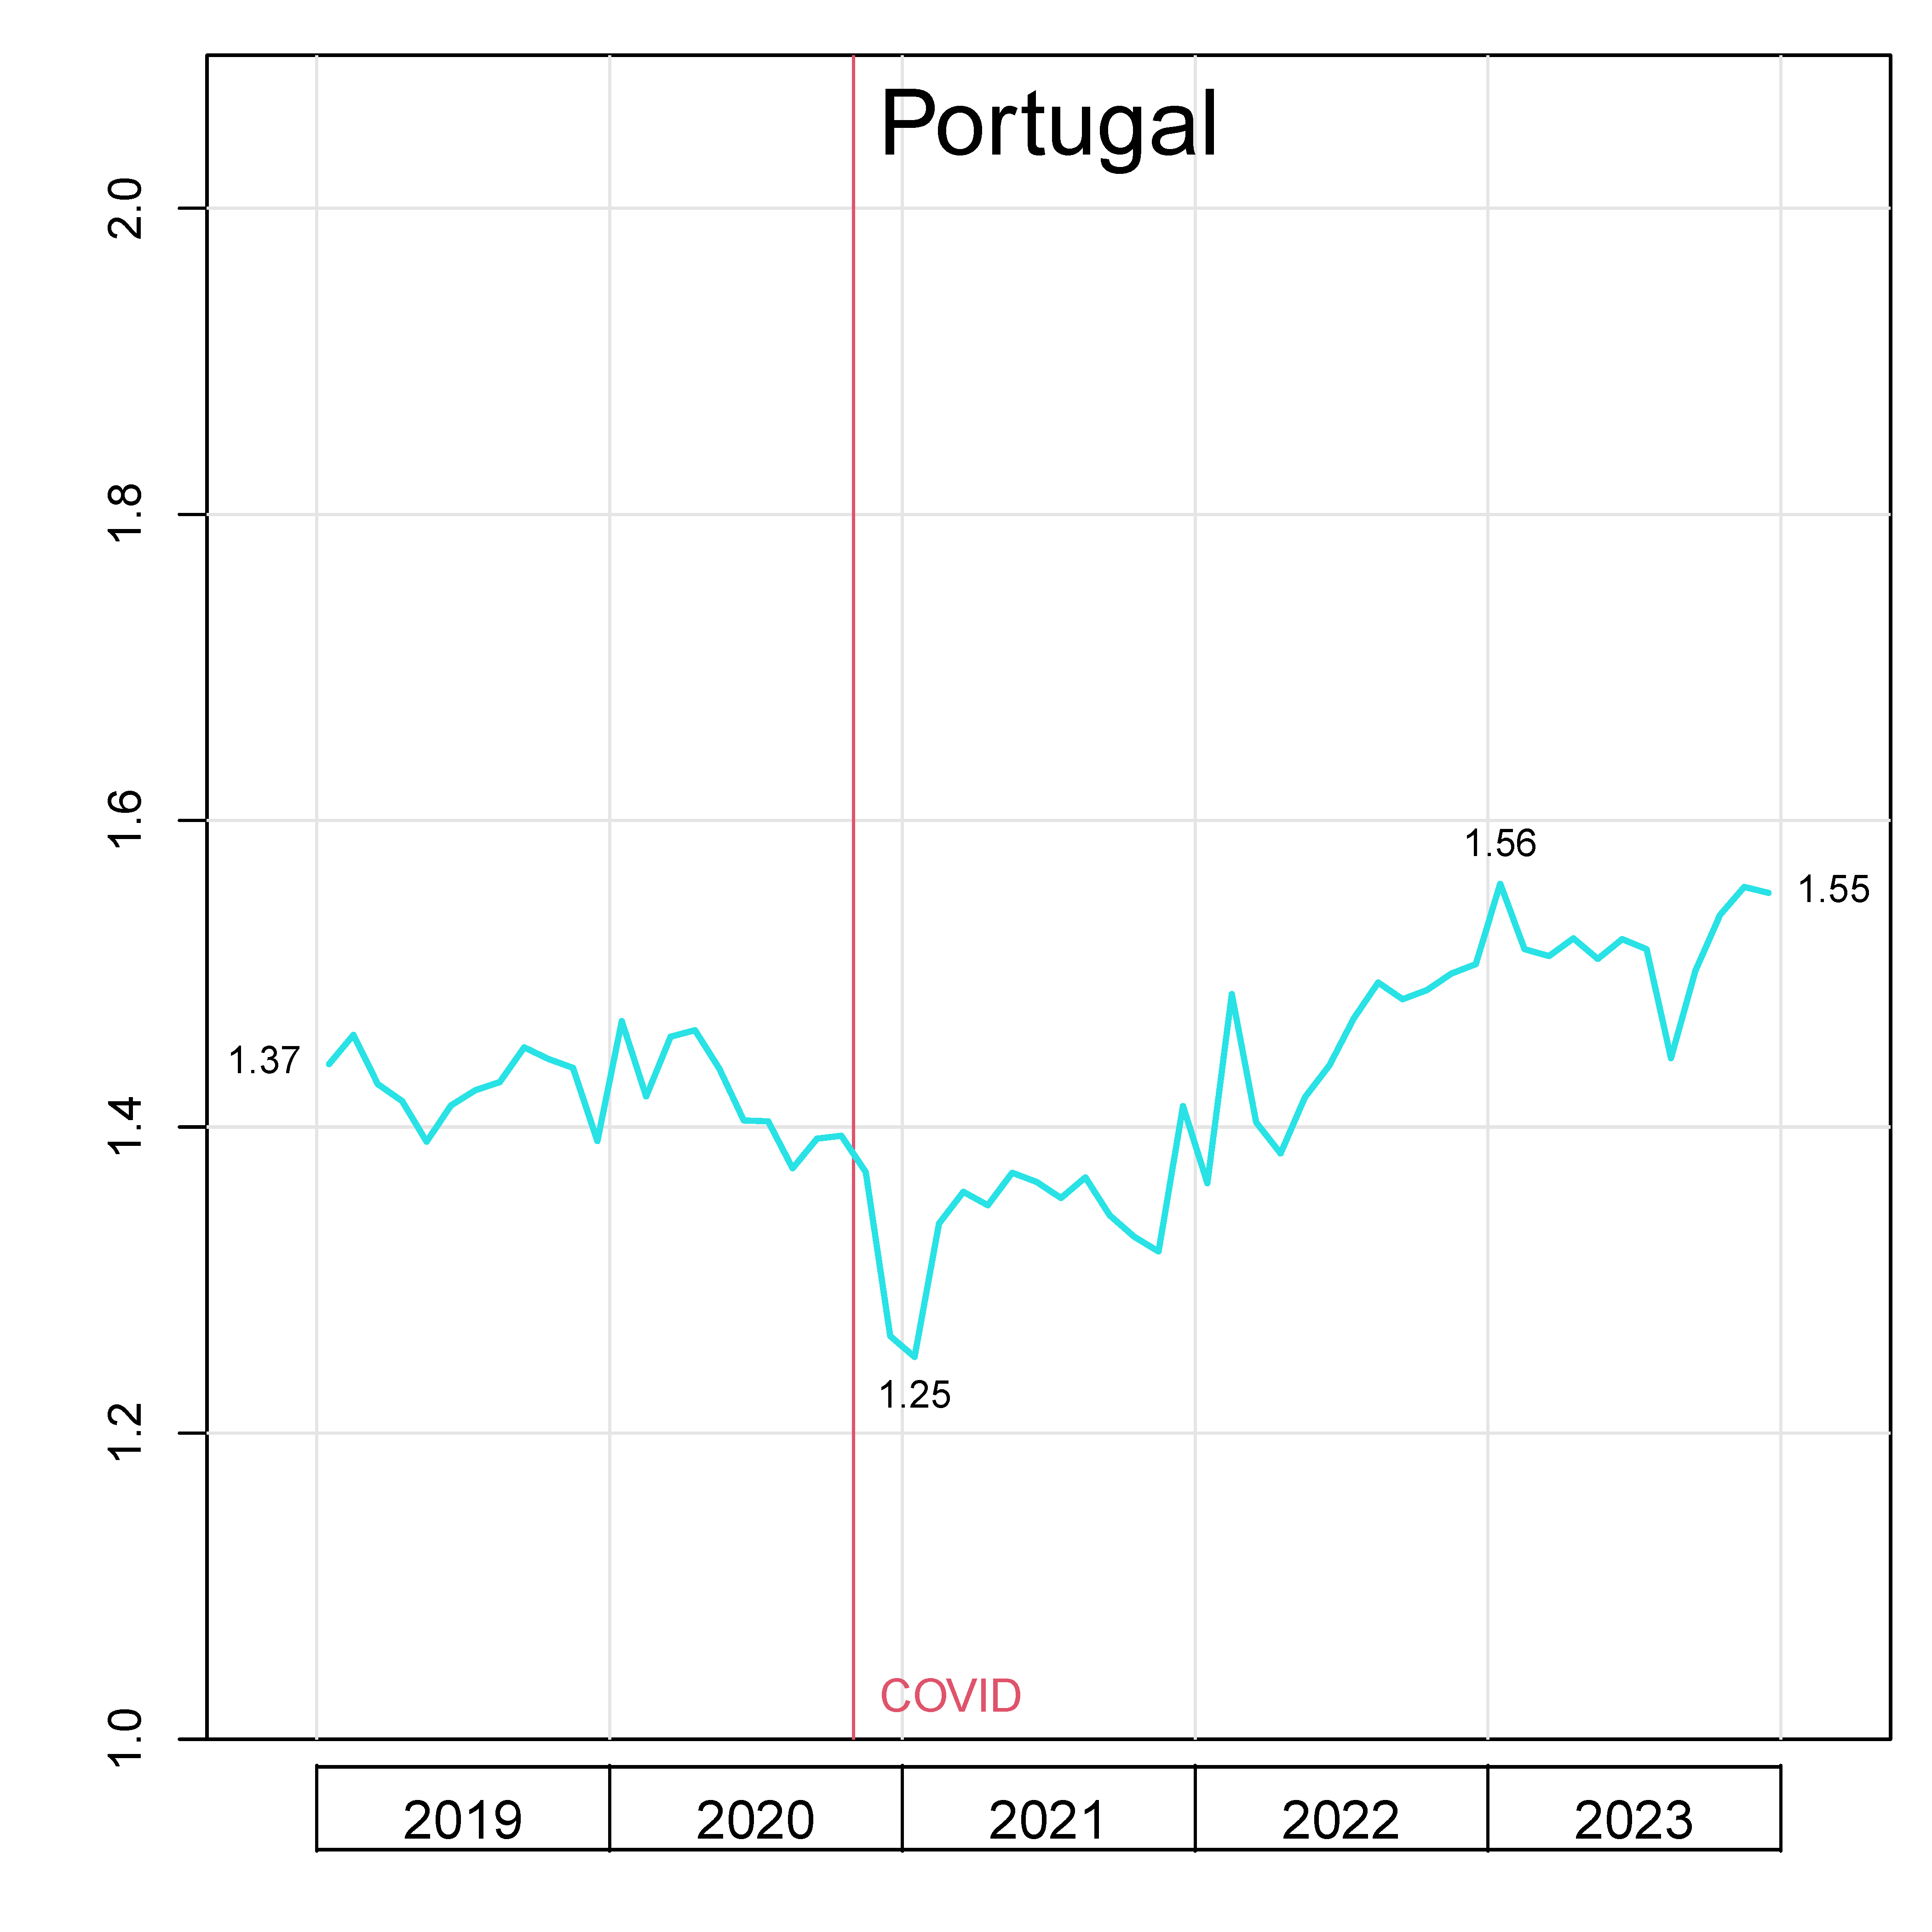
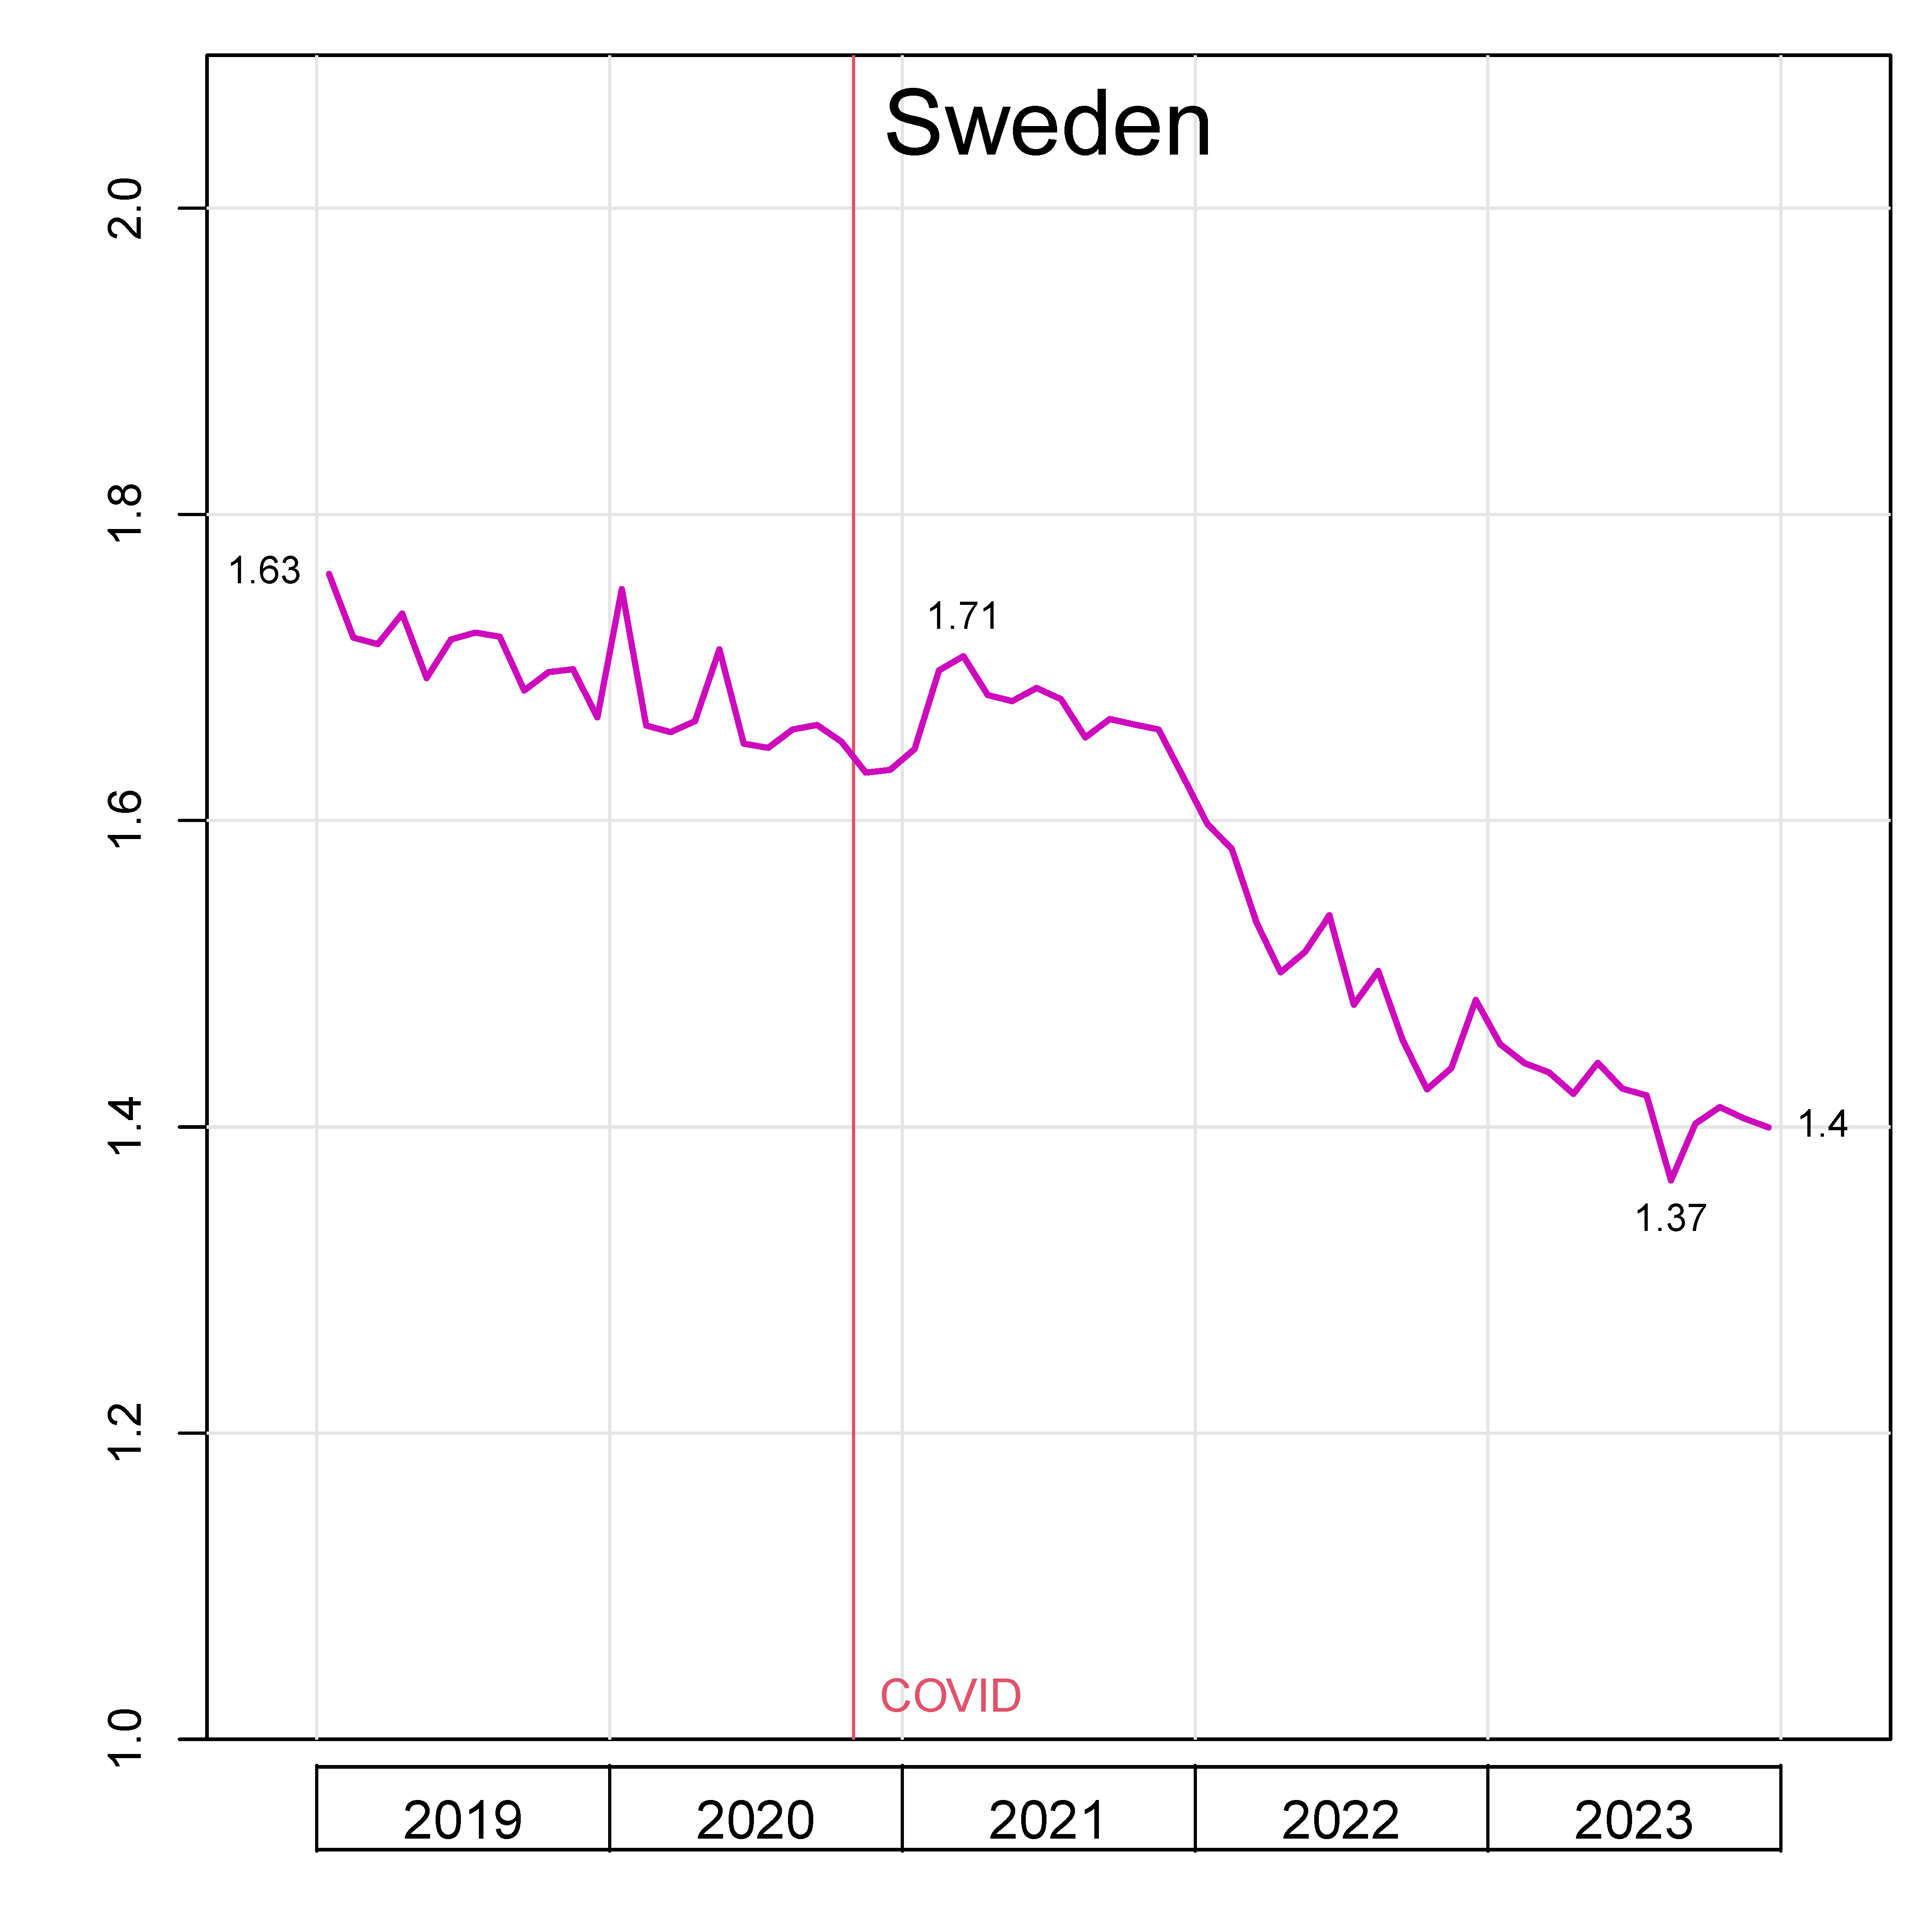
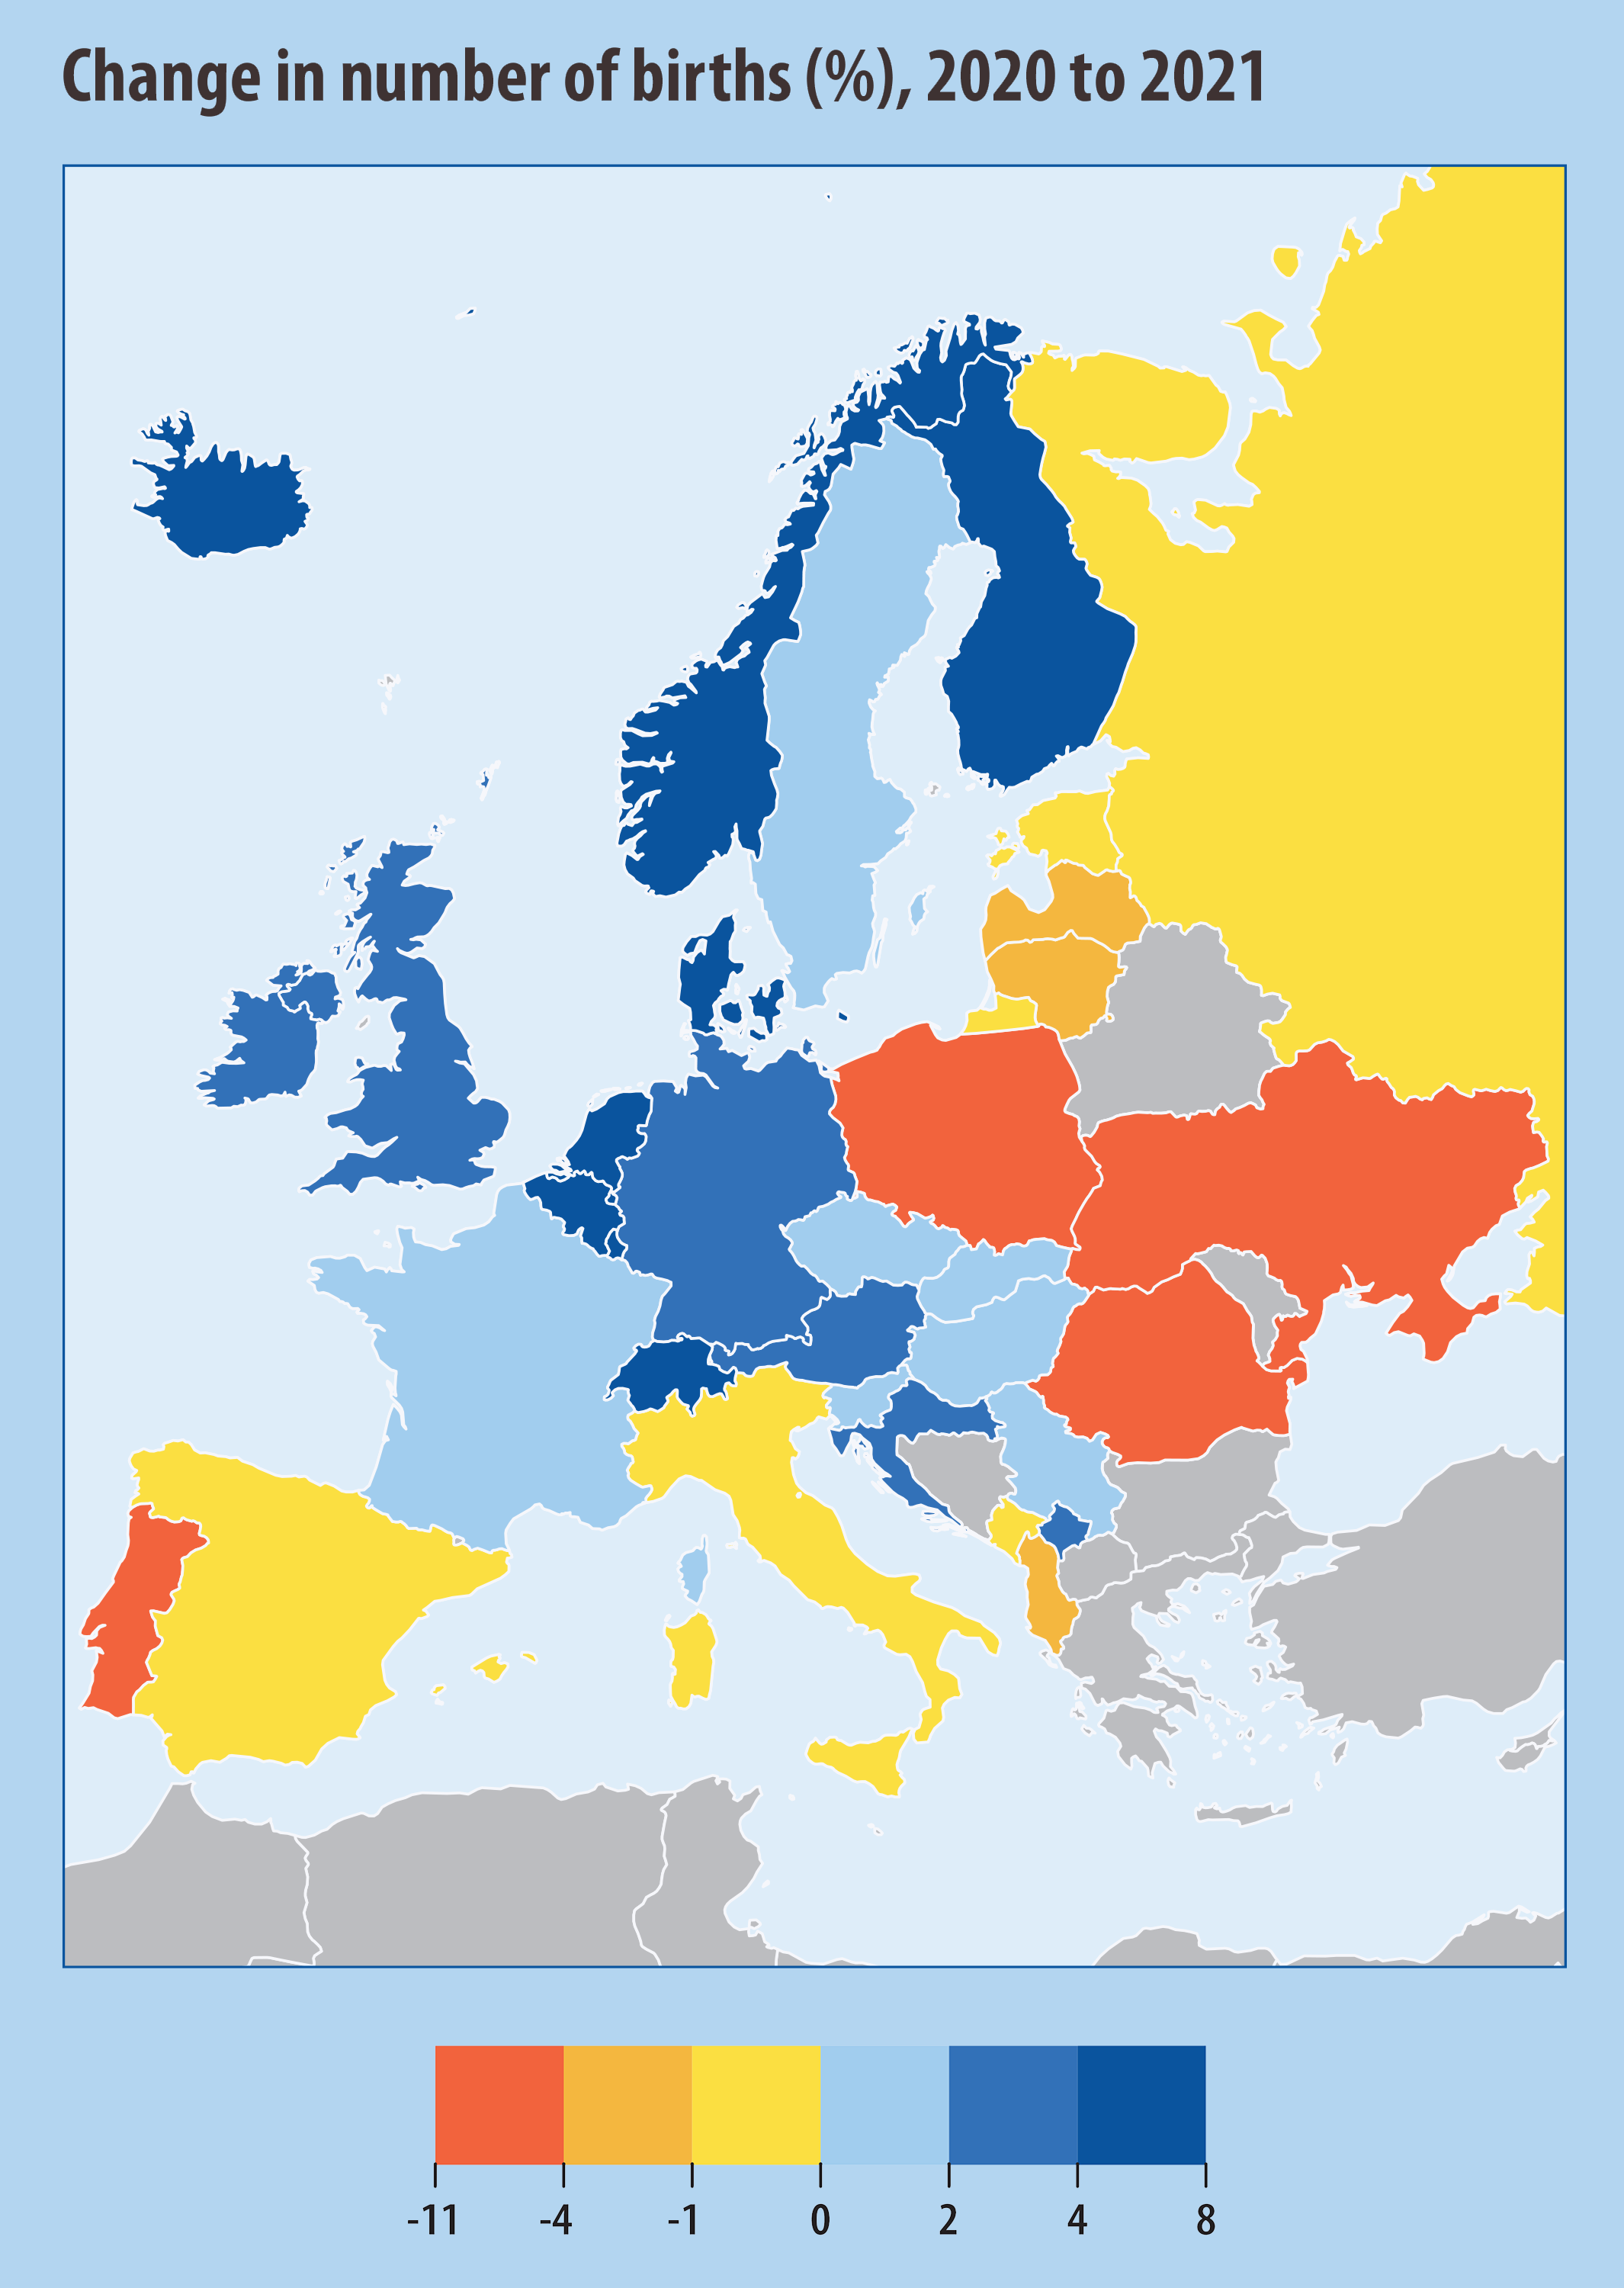
The onset of the COVID-19 pandemic marked a turn towards unstable fertility trends. Two major shocks framed and fuelled these ups and downs in fertility rates. First, starting in early 2020, fertility was affected by the pandemic and its repercussions in the form of infection waves and containment policies, as well as economic and labour market interventions. Second, starting in February 2022, the Russian war against Ukraine contributed to higher inflation, rising energy prices, stagnating incomes and economic and political uncertainty. We use monthly estimates of total fertility rates (TFR) from 2019 to 2025 (or the latest available) produced by the Human Fertility Database (STFF series) to illustrate this instability.
Overall, fertility rates across Europe dropped between 2019 and 2025. In the European Union (data available for 16 countries), the average TFR fell from 1.55 in 2019 to 1.36 in 2025. This broader picture masks substantial variation across countries and over time. Many countries with higher fertility rates in 2019, such as Czechia, France, Norway and Sweden, saw steeper fertility declines than countries with lower initial fertility, leading to a convergence to low or very low total fertility at or below 1.5 in most of Europe.
Three distinct fertility shifts can be identified during this period. First, the onset of the COVID-19 pandemic often resulted in a short-term drop in fertility rates about nine months later, in December 2020 and January 2021, especially in countries strongly affected by the initial wave of infections and deaths, such as Belgium, France, Italy and Spain. Second, pandemic containment policies and large-scale government interventions aimed at propping up economies and labour markets were often linked to a rise in fertility during 2021. Third, this short-lived mini baby boom was followed by a fall in fertility rates starting around December 2021. This trend was initially linked to rising inflation, the rollout of mass vaccination and the gradual return to more “normal” work and social lives at a later phase of the pandemic. In many countries, fertility continued falling throughout 2022–2024, a period of higher inflation, stagnating incomes and increased uncertainty following the start of the Russian war against Ukraine. Recently, fertility rates have stabilised in most countries, with a few (e.g., Denmark, Finland, Portugal and Spain) experiencing a slight upturn in fertility in 2025.
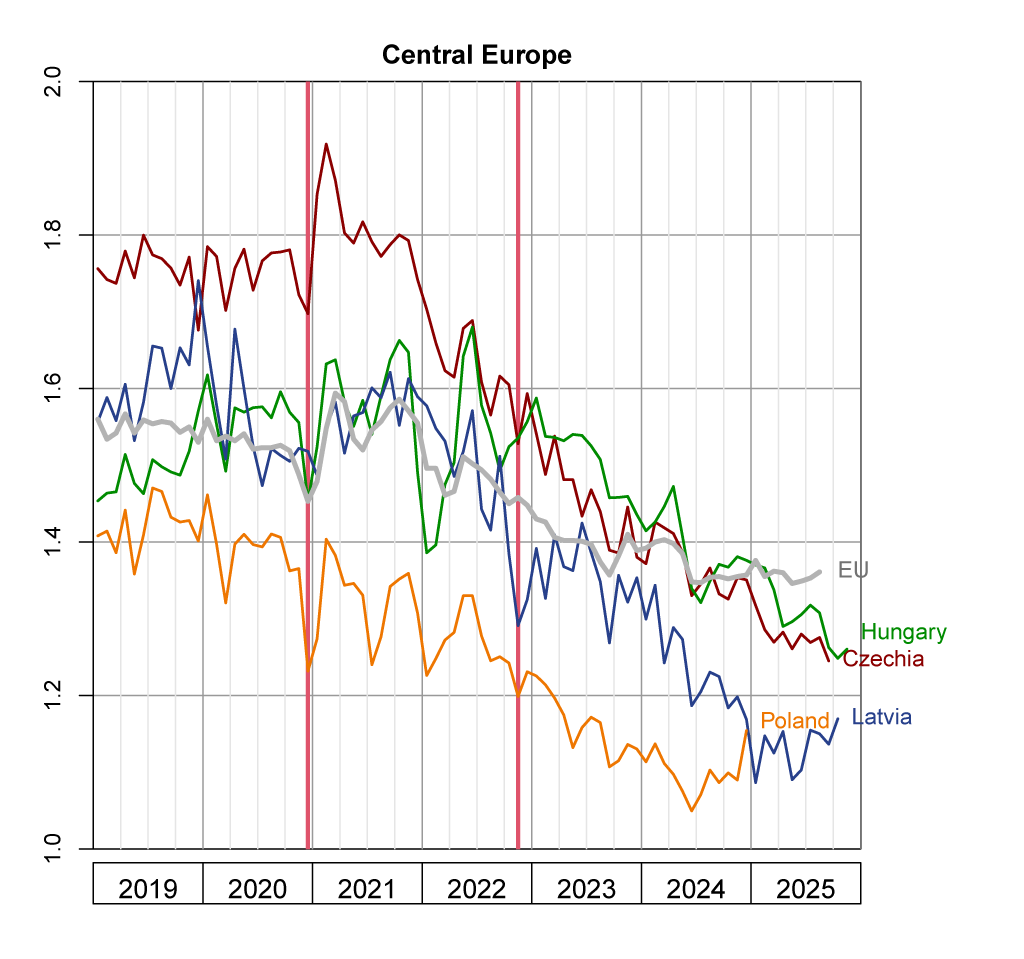
These fertility trends varied considerably by region. Western European and Nordic countries and the three German-speaking countries mostly followed the broader European trends sketched out above. In Southern Europe, fertility rates were remarkably stable, with the TFRs declining only slightly since 2021, after falling sharply in response to the start of the pandemic and then briefly recovering. By contrast, countries in Central and Eastern Europe saw the most prolonged and largest fertility declines, reversing the fertility recovery of the previous decade. Fertility dropped steeply in some of the countries in close proximity to the Russian war against Ukraine (e.g., in the Baltic states and Poland, Ukraine itself and Belarus (not shown)) and in countries experiencing large refugee flows from Ukraine (e.g., Czechia).
Figures:
Figure 1: Total fertility rate by month in Western countries, 2019–2025
Figure 2: Total fertility rate by month in German speaking countries, 2019–2025
Figure 3: Total fertility rate by month in Nordic countries, 2019–2025
Figure 4: Total fertility rate by month in Southern Europe, 2019–2025
Figure 5: Total fertility rate by month in Central Europe, 2019–2025
References:
Human Fertility Database. Short-Term Fertility Fluctuations. Max Planck Institute for Demographic Research (Germany) and Vienna Institute of Demography (Austria). Available at https://www.humanfertility.org
Project site: https://www.humanfertility.org/Data/STFF
Paola di Giulio
Period fertility rates often display sharp fluctuations, especially in times characterised by economic and political upheavals and policy changes. We illustrate the imprint left by the COVID-In many countries, the COVID-19 pandemic led to an increase in the number of deaths and a temporary decrease in life expectancy (see estimates of excess deaths in the country data table). But did this trend shorten life expectancy in poor health in particular, given that the pandemic mainly affected people who were older, frail and experiencing severe health limitations? Or did it negatively impact both healthy and unhealthy life expectancy?
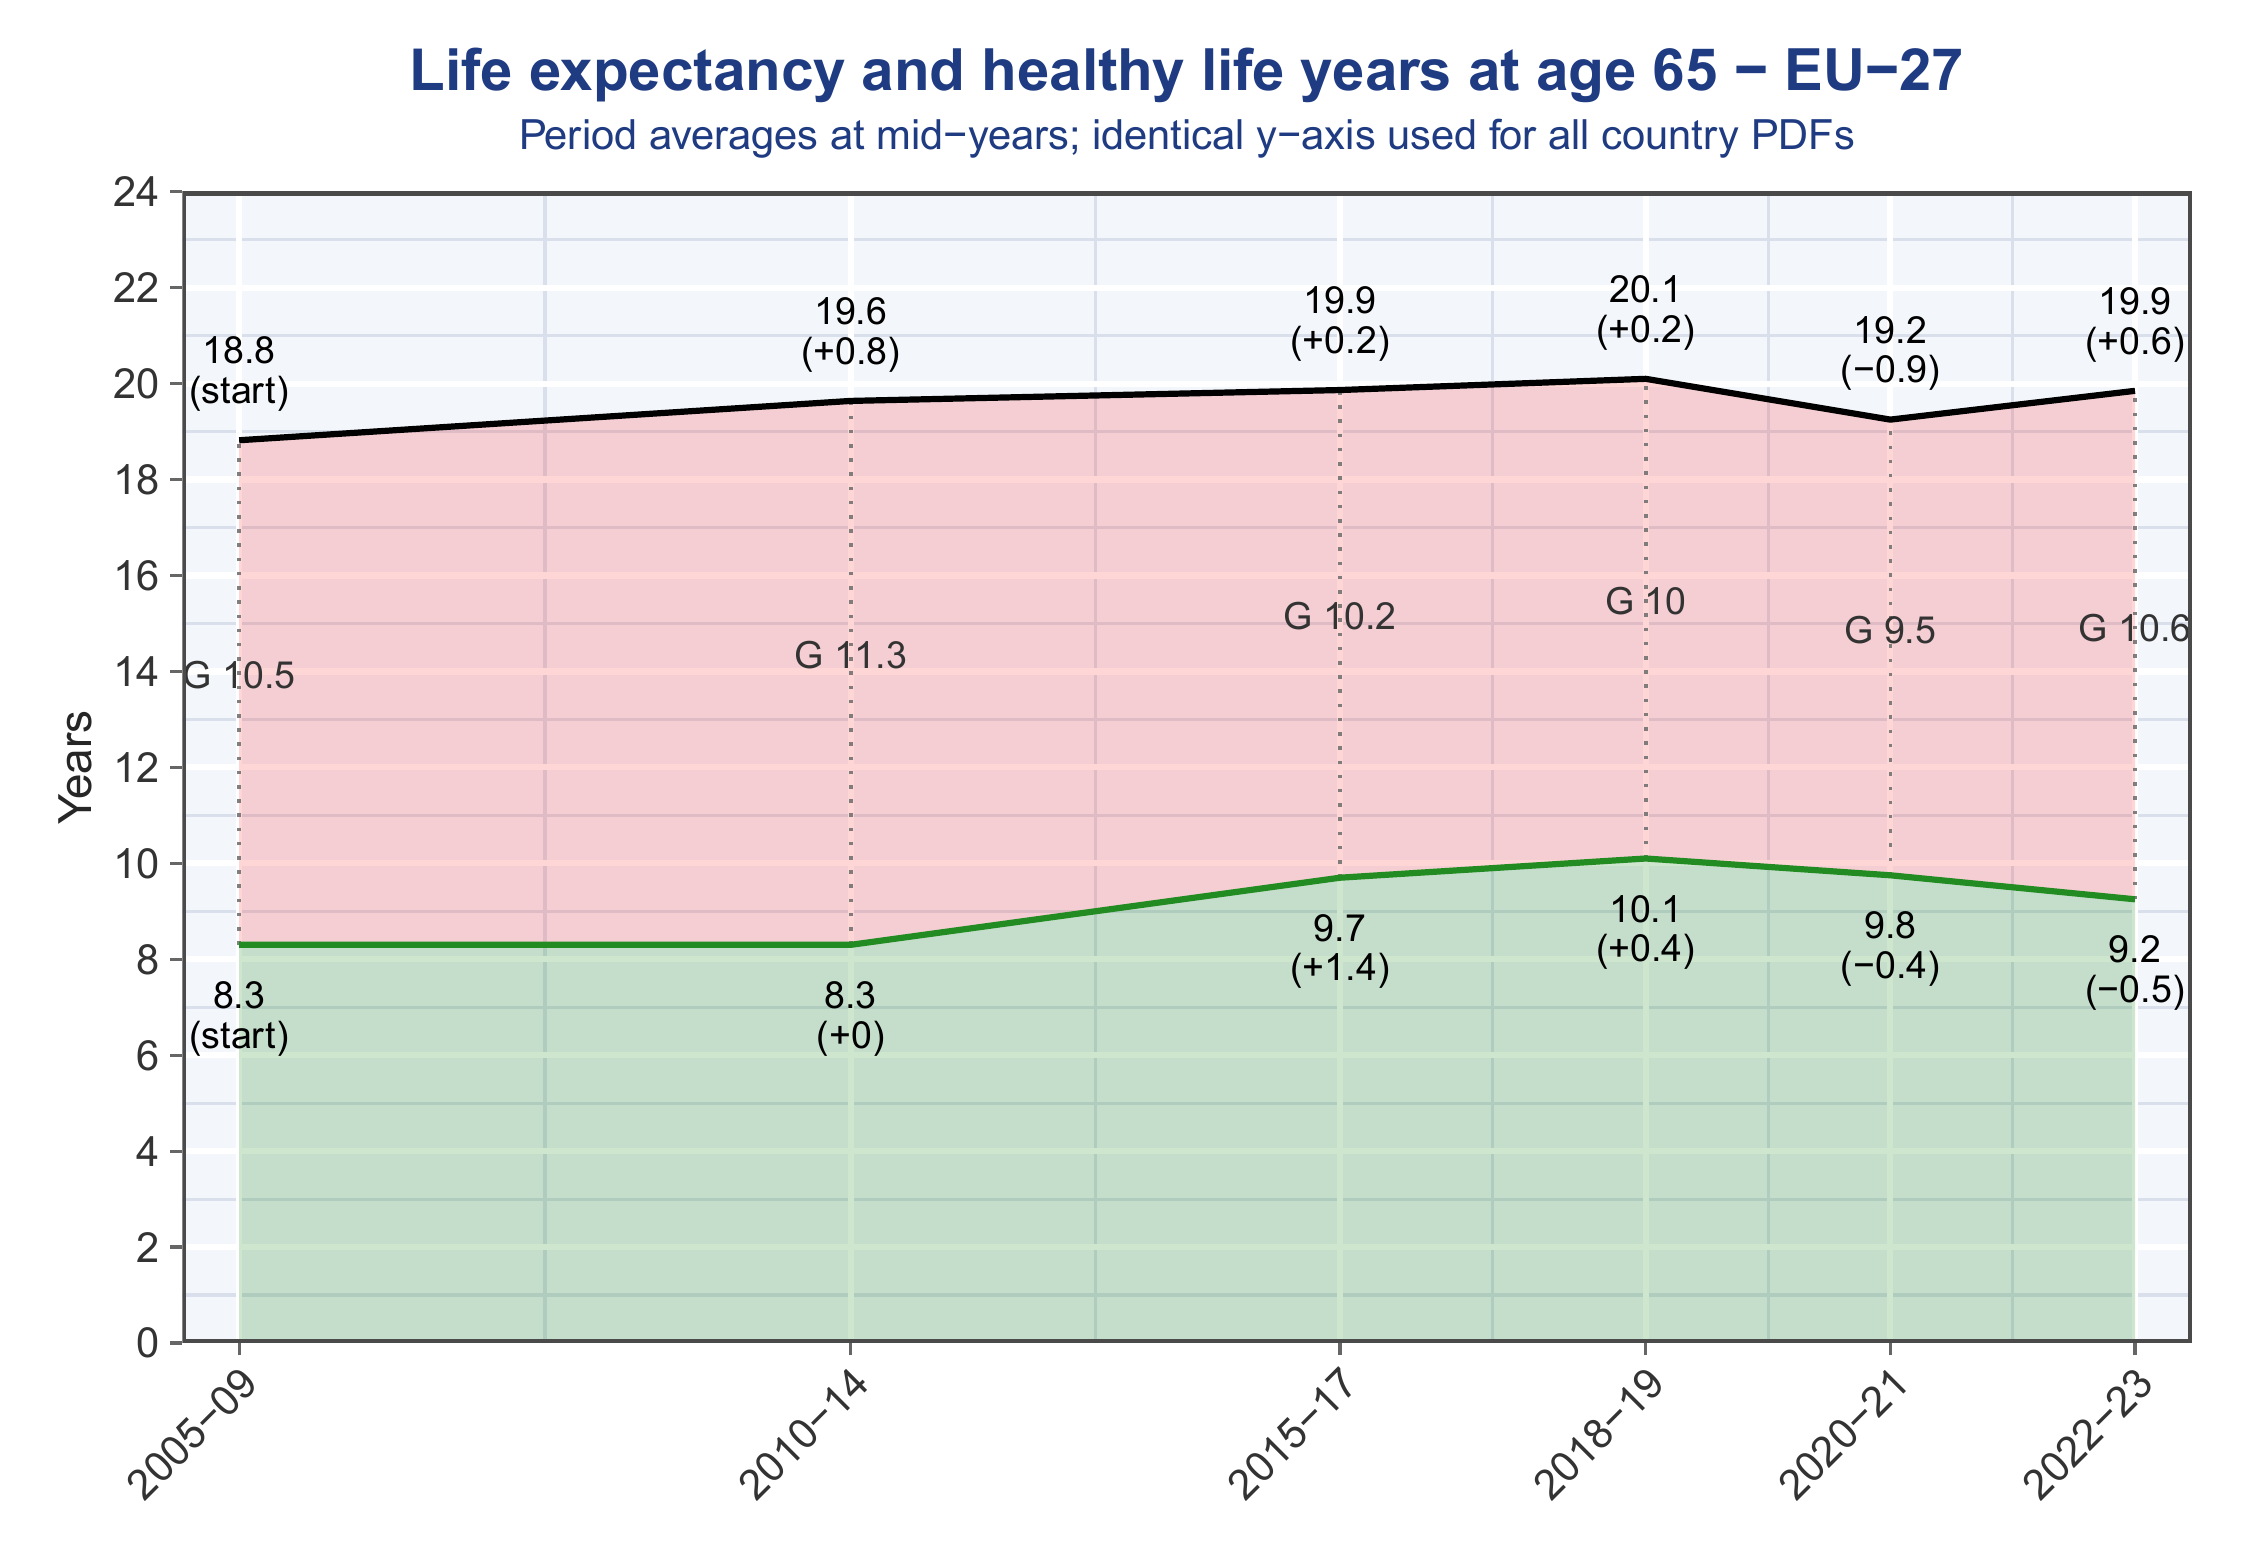
We analyse this question for selected European countries (see the online version for expanded coverage) using the indicator of healthy life years (HLY), defined by the European Commission as the number of remaining years an individual is expected to live without long-standing limitations in usual activities of daily living (Global Activity Limitations Indicator), based on EU-SILC data published by Eurostat. We calculate the complementary indicator, unhealthy life years, as the difference between life expectancy and healthy life years. It captures the life years spent with activity limitations.
We focus on the population at ages 65 and older, who often have health limitations and were strongly impacted by the COVID-19 pandemic. The figure covers longer-term trends from 2005 to 2023 and the data are averaged across several years to smooth fluctuations due to the small survey sample size.
Life expectancy at age 65 in the EU increased from 17.7 years in 2000 to 20.2 years in 2019, with slowing gains from the mid-2010s onwards. However, this upward trend did not coincide with a consistent improvement in population health. By the end of 2010s, countries differed widely in the distribution of remaining life years by health status: in Sweden, only about a quarter of later life (about five years) was spent with health limitations, whereas in Austria and Poland, life years spent with limitations accounted for at least half of the remaining life expectancy (around 10 years).
The pandemic caused a marked temporary increase in mortality at older ages across the EU, with life expectancy at age 65 decreasing by about one year between 2018–2019 and 2020–2021. Over the same period, several countries recorded a temporary decline in unhealthy life years. This apparent improvement in population health may reflect a selection effect caused by the COVID-19 pandemic. Due to more sick and frail elderly people dying, the surviving population was on average healthier. Such a shift is visible in Austria, France and Poland. But this pattern was not universal across Europe. Several countries, including Sweden, experienced increases in years lived with limitations in the first two years of the pandemic, while in a large group of countries, including Spain, both healthy and unhealthy life years decreased in parallel.
The reduction in unhealthy life years observed in many countries during the pandemic did not persist. From 2022 onwards, as life expectancy began to increase again, most countries also experienced an increase in unhealthy life years. Austria is a notable exception to this trend. It is likely that the longer-term effects of COVID-19, together with disruptions to healthcare services, contributed to the observed reversal.
Caution is needed when interpreting the observed trends. The analysed indicators are based on self-reported data, and changes in survey implementation during the pandemic – for example, due to shifts from face-to-face interviews to telephone or web interviews – may have affected responses.
Figures:
Figure 1: Life expectancy and healthy life years at age 65 - Austria, 2005-2023
Figure 2: Life expectancy and healthy life years at age 65 - France, 2005-2023
Figure 3: Life expectancy and healthy life years at age 65 - Poland, 2005-2023
Figure 4: Life expectancy and healthy life years at age 65 - Spain, 2005-2023
Figure 5: Life expectancy and healthy life years at age 65 - Sweden, 2005-2023
Figure 6: Life expectancy and healthy life years at age 65 - EU-27, 2005-2023
References:
Eurostat database. Healthy life years by sex. https://ec.europa.eu/eurostat/databrowser/view/hlth_hlye/default/table?lang=en
Project site: https://www.oeaw.ac.at/vid/research/health-and-longevity
Tomáš Sobotka and Kryštof Zeman
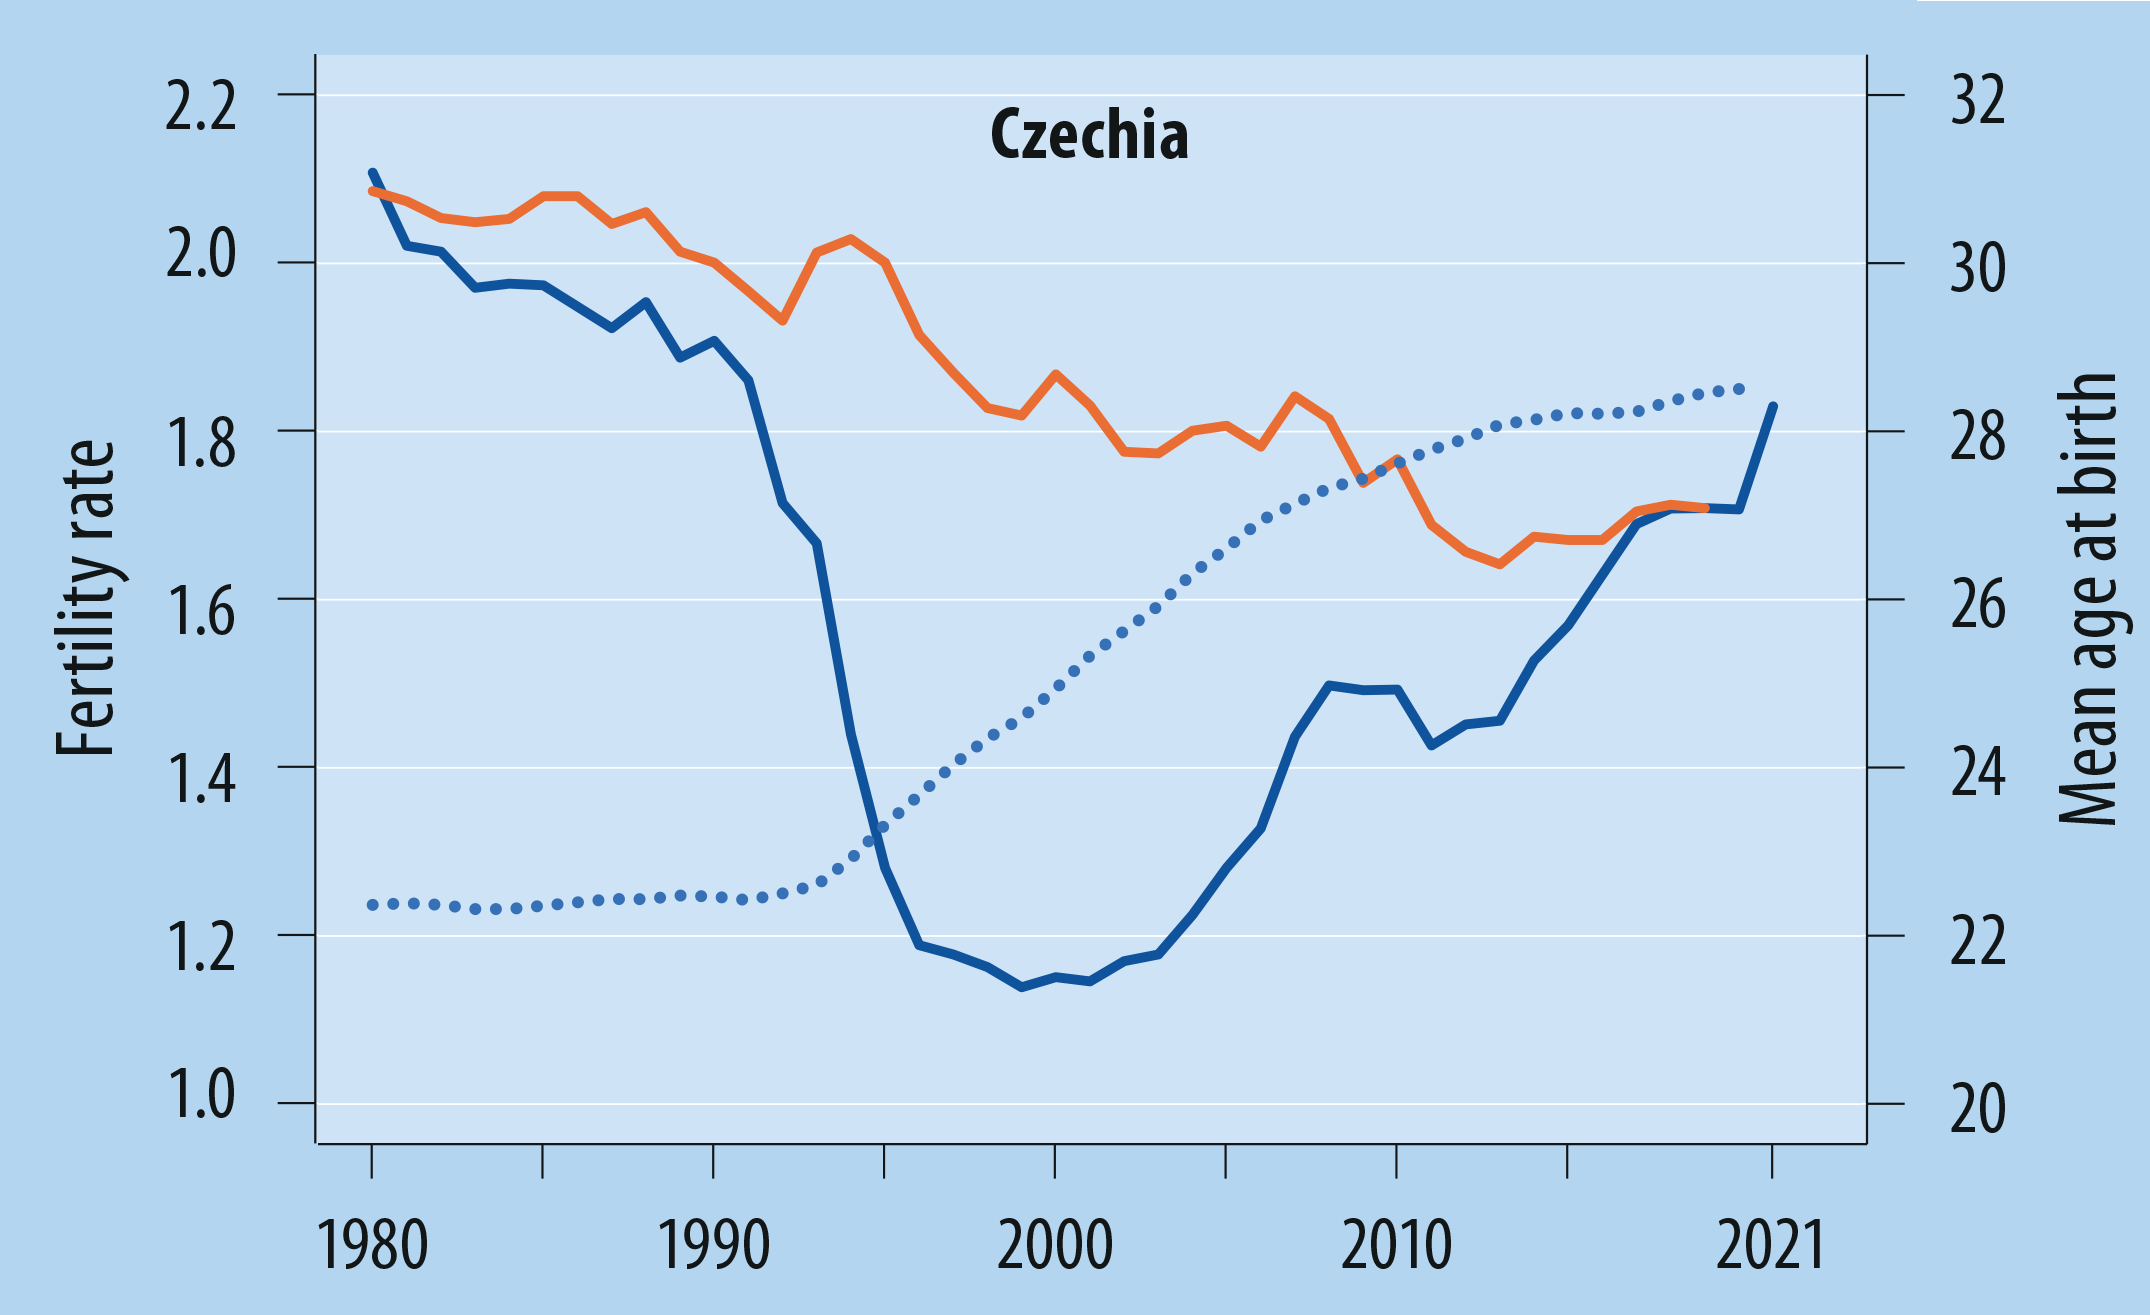
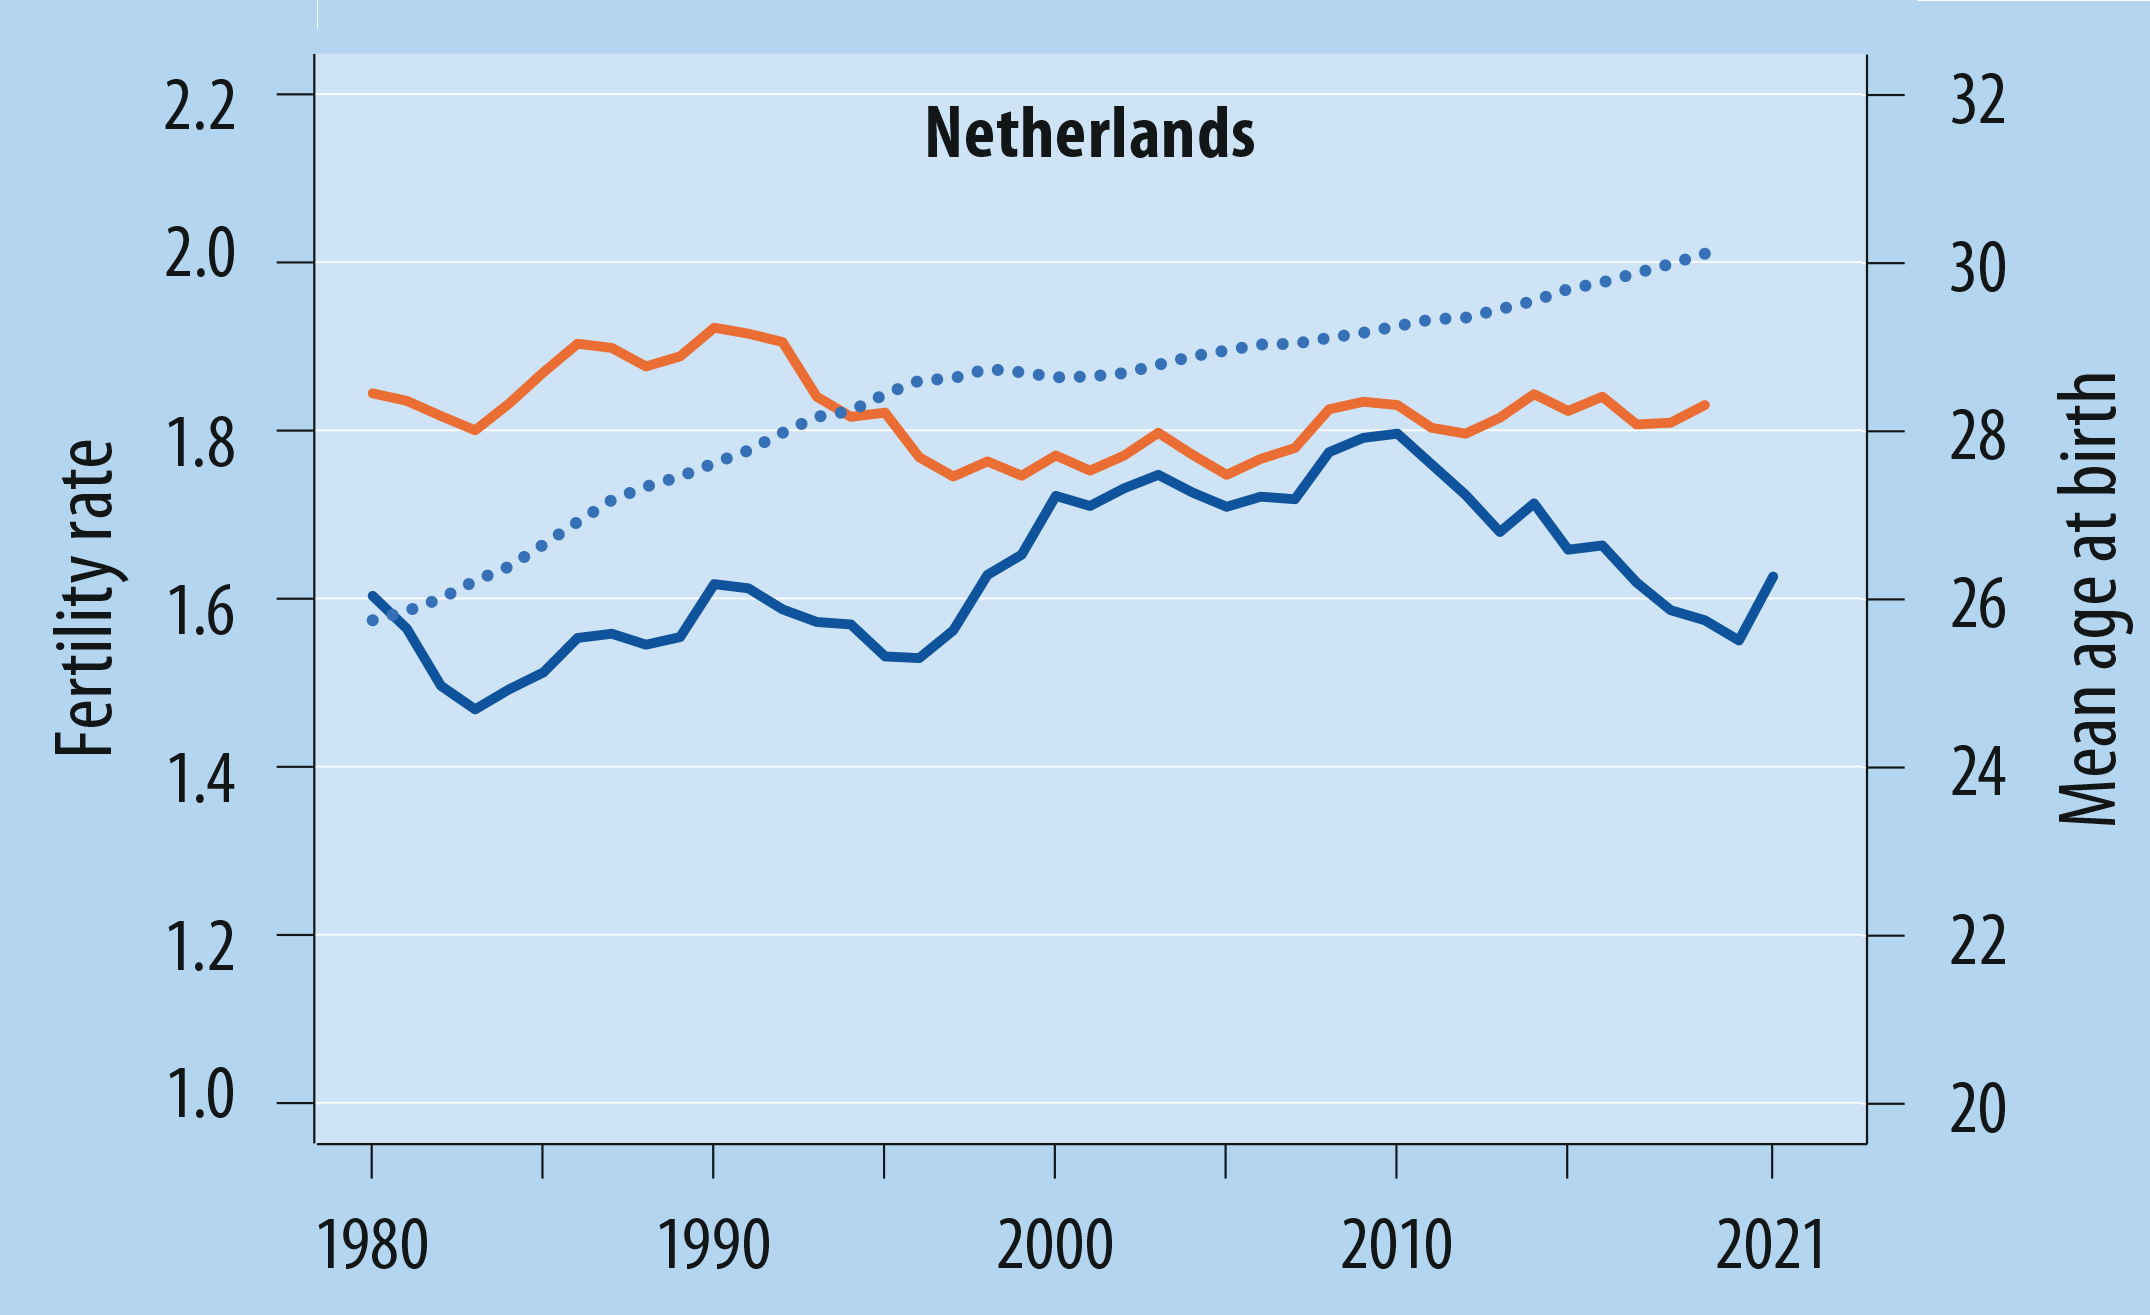
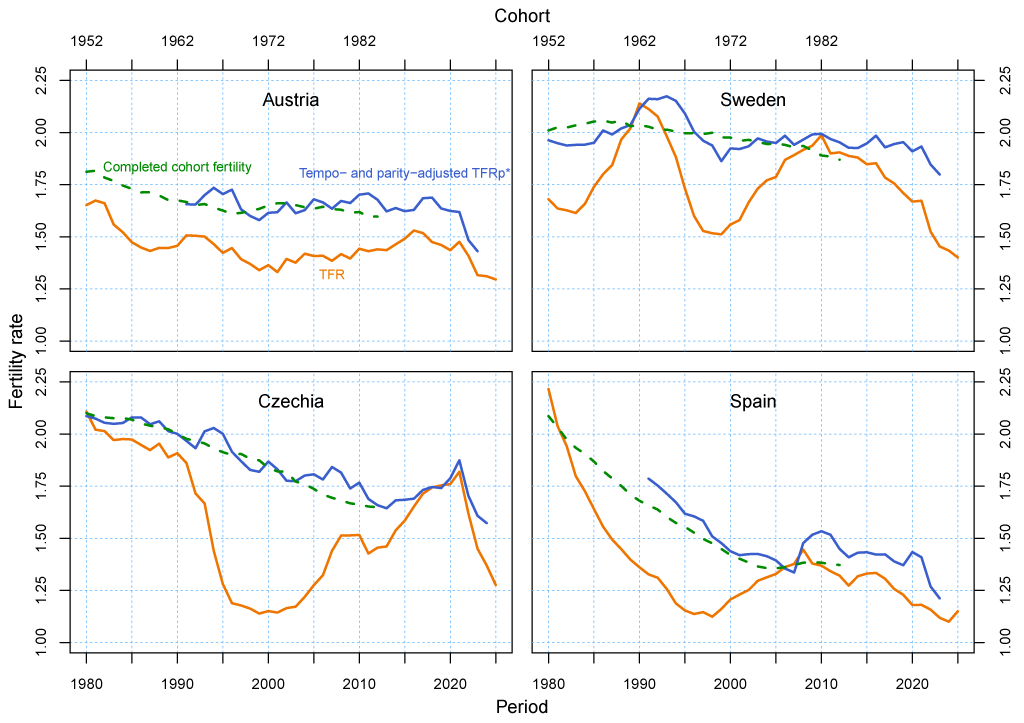
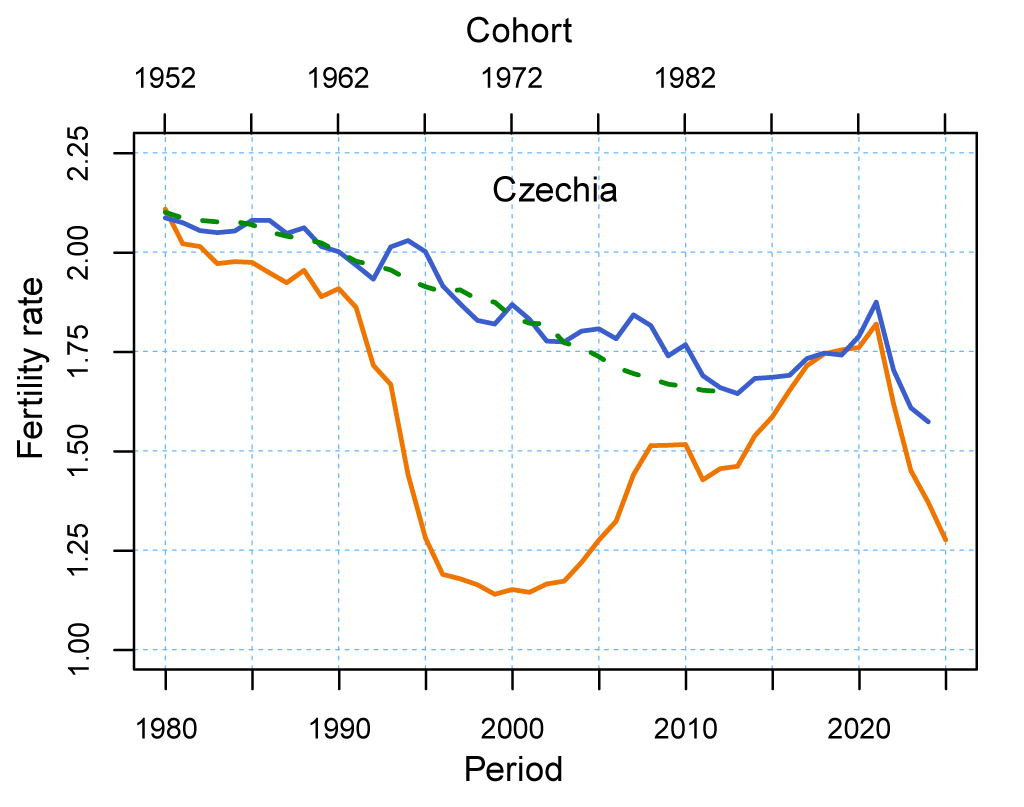
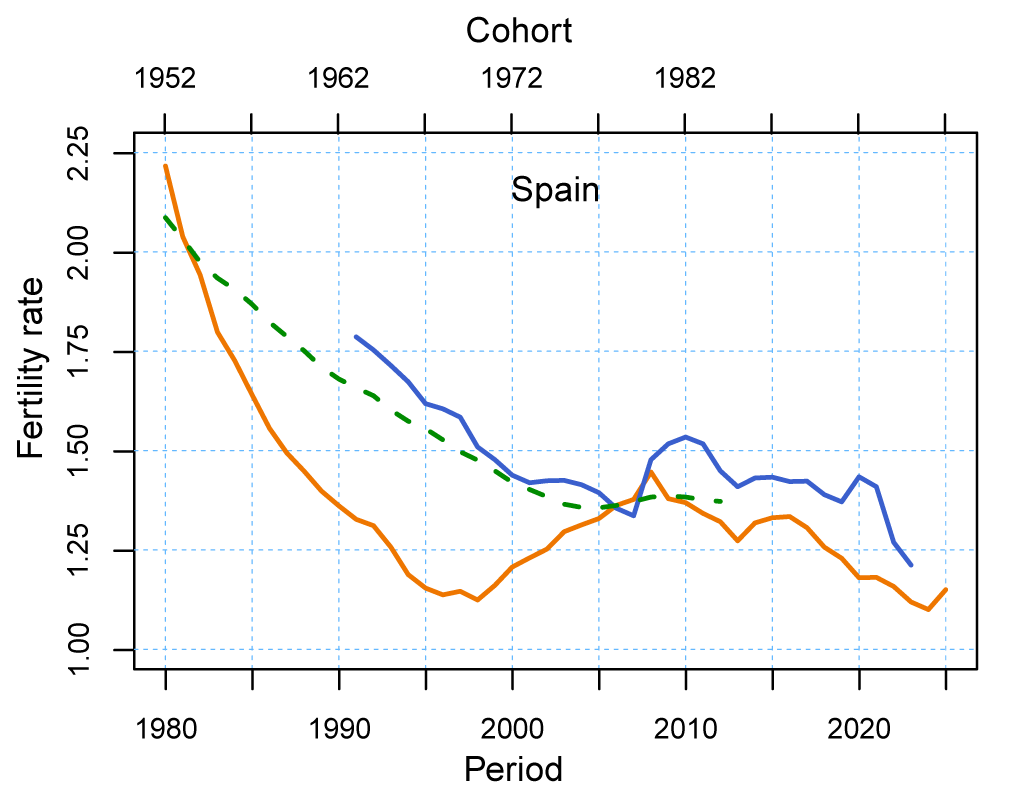
Parents in Europe have their first child at ever later ages. Today, women in some countries, such as Italy and Spain, become mothers at ages 31–32 on average – about seven years later than half a century ago. This trend distorts the most common measure of period fertility, the total fertility rate (TFR). As births shift to later ages, they are both postponed into the future and spread over a longer period of time. This “stretching” of reproduction depresses the period TFR, even if the number of children women have over their reproductive lives (completed cohort fertility, CTFR) does not change. A possible correction of this “tempo effect” is offered by the tempo- and parity-adjusted total fertility rate (TFRp*), an indicator based on age- and parity-specific fertility rates and changes in the mean age at birth by birth order (Bongaarts and Sobotka 2012). The TFRp* is a more accurate measure of the period number of children per woman. While it often diverges markedly from the TFR, the TFRp* closely tracks the levels and trends in the completed cohort fertility of the women having children during that period.
The figure illustrates the trends in the period fertility rates (TFR and TFRp*) in four European countries in 1980–2025 and compares them with the completed cohort fertility rate (CTFR) of women who were aged 28 (a typical age at reproduction) in this period. In Austria, the fertility rates were remarkably stable from the 1990s until 2021, with the TFRp* and the CTFR remaining at 1.6–1.7, surpassing the period TFR by about 0.2 births per woman. In Sweden, sharp fluctuations in the period TFRs contrasted with much more stable trends and higher levels in the TFRp* and the CTFR, which hovered close to 2.0. Czechia saw even wilder swings in the TFR. The TFR plummeted in the 1990s and gradually recovered in the 2000s and 2010s. Meanwhile, the CTFR and the TFRp* continued declining gradually until the two period indicators converged and started rising in the 2010s. By contrast, in Spain, the TFR and the TFRp* decreased sharply in tandem until the 1990s, underwent a partial recovery in the 2000s and stayed low and rather stable in the 2010s.
Most recently, in 2022–2025, a period covering a later stage of the COVID-19 pandemic and the Russian war against Ukraine, both the conventional TFR and its adjusted counterpart, the TFRp*, fell in parallel (see the “Shocks and babies” box for more details). While the tempo-adjusted TFRp* remained above the TFR, this trend, if sustained, will eventually result in a decline in the cohort fertility rate among women born in the mid- to late 1990s in all four analysed countries.
Figures:
Figure 1: Fertility trends Austria, 1980–2025
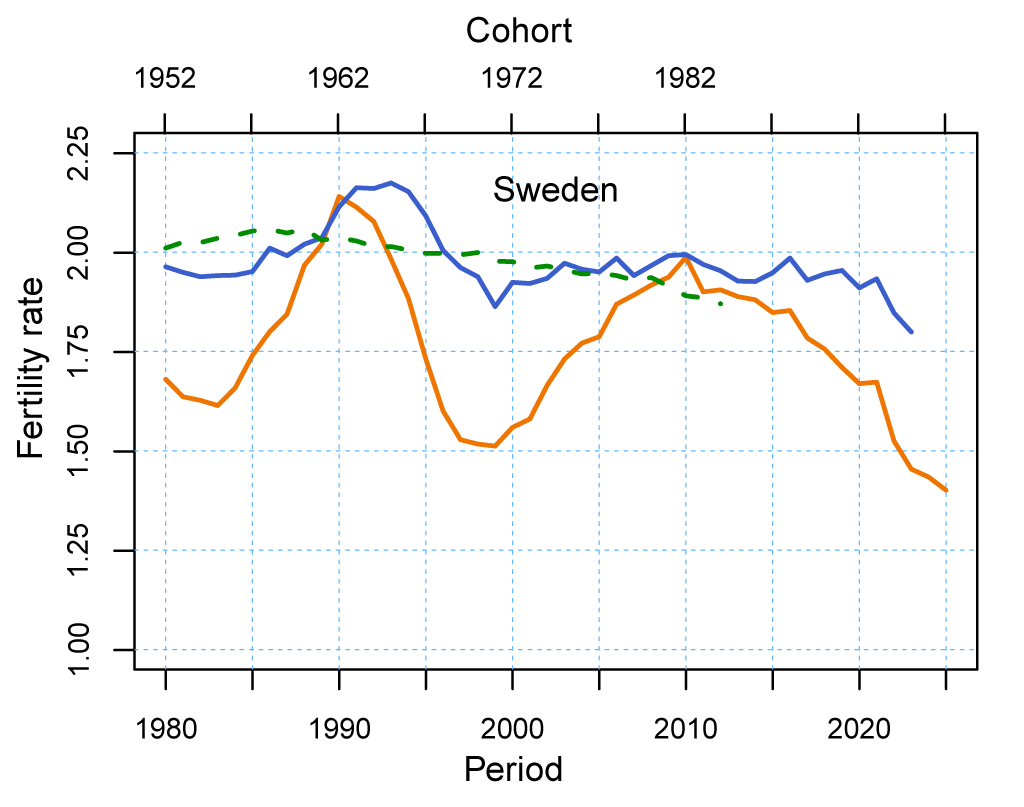
Figure 2: Fertility trends Sweden, 1980–2025
Figure 3: Fertility trends Czechia, 1980–2025
Figure 4: Fertility trends Spain, 1980–2025
References:
Bongaarts, J. and Feeney, G. 1998. On the quantum and tempo of fertility. Population and Development Review 24(2): 271–291. https://doi.org/10.2307/2807974
Bongaarts, J. and Sobotka, T. 2012. A demographic explanation for the recent rise in European fertility. Population and Development Review 38(1): 83–120. https://doi.org/10.1111/j.1728-4457.2012.00473.x
Sonja Spitzer, Adèle Lemoine, Claudia Reiter, Constantin Kumaus and Zhanxiong Song
Parenting leave policies in Europe have changed substantially over time. Maternity leave was introduced in some European countries as early as the late 19th century, initially to protect the health of the mother and her newborn child. Paid parental leave, which allows parents to take time off work while receiving income support, emerged later and expanded rapidly during the late 20th century. The European Parenting Leave Policies (EPLP) Dataset provides harmonised information on maternity, co-parent, paid parental and job-protected leave regulations across 21 European countries from 1970 to 2024 (eplp-dataset.org). Of these 21 countries, only three – Austria, Hungary and Sweden – provided paid parental leave in 1970. At that time, the average duration was around 11 weeks. By 1980, it had increased to 23 weeks. By 1990, the average duration had reached 44 weeks, with some countries like Czechia, Hungary and Slovakia providing more than two years of paid parental leave.
Initially, parental leave was available only to mothers. Sweden was the first country to make parental leave available to fathers in 1974. During the next decades, most European countries started offering leave to both parents, marking a shift towards policies that focused more on reconciling work and family life and promoting gender equality in paid and unpaid work. In line with this shift, the overall length of paid parental leave largely plateaued from around 1990 onwards, with only job-protected leave continuing to increase. Rather than further extending paid parental leave, reforms concentrated on involving fathers. Two instruments have become increasingly prominent in recent decades. First, paternity leave – short and often job-protected leave reserved for fathers after childbirth – has spread widely across Europe. By 2024, 19 out of 21 countries analysed had introduced statutory paternity leave. Its average duration increased from two days in 1990 to 5.2 weeks in 2024. Second, many countries introduced non-transferable parental leave quotas reserved for the father or second parent. These individual entitlements created incentives for fathers to take leave by making parts of the benefit conditional on their participation.
In recent decades, parenting leave policies have diversified. Systems have become more flexible, combining multiple schemes and benefit types, e.g. flat-rate and income-replacement schemes. Many countries introduced options to work part time while receiving benefits, split leave between parents in different ways or to use leave until the child is older. Some countries introduced monetary incentives for equal leave sharing between parents. Entitlements have also increasingly been extended to diverse family forms, including same-sex couples and adoptive parents. As a result, European parenting leave policies have evolved from short leave entitlements intended to protect mothers’ health into complex policy packages aimed at income support, improving parent and child wellbeing and promoting labour market attachment and gender equality.
Figures:
Figure: Parenting leave regulations 1970-2024
References:
Spitzer, S., Lemoine, A., Song, Z. et al. (2026). The European Parenting Leave Policies (EPLP) Dataset: Leave duration entitlements for 21 countries from 1970 to 2024. Demographic Research (forthcoming).
Project site: https://eplp-dataset.org/

Shalini Singh, Ester Lazzari and Cristina Suero
Despite fertility rates dropping well below replacement level and permanent childlessness becoming more common, the two-child family ideal remains remarkably persistent in low-fertility societies. Consequently, many people report having unrealised fertility aspirations. Using data from the second round of the Generations and Gender Survey (GGS-II, 2020–2025), we illustrate the relationship between women’s retrospective ideal family size and their actual number of children at ages 42–50 across selected countries. This approach captures to what extent fertility aspirations may be perceived as unfulfilled, and how women assess their family size towards the end of their reproductive years.
Figure 1 displays the retrospective ideal family size women report near the end of their reproductive life, their actual family size and the gap between the two across countries and by educational attainment. In all countries analysed, women report that they would have ideally had more than two children on average, while their actual number of children is consistently lower. This produces a gap between the ideal and the actual family size ranging from 0.3 to almost one child. Two patterns emerge. First, differences in fertility ideals by education are small. However, tertiary-educated women tend to have fewer children on average, leading to a larger discrepancy between their ideal and their actual family size. Second, although this gap appears in both educational groups across all countries examined, its magnitude varies, with no clear regional pattern.
Figure 2 shifts the focus to the individual level. It shows the share of women aged 42–50 who have fewer children than they consider ideal (underachievers), those who have achieved their ideal family size and those who have exceeded it (overachievers). Many women report falling short of their ideals: in most countries, between one-third and one-half of women report having fewer children than they ideally wanted.
Tertiary-educated women are more likely to report having unrealised fertility than women with lower levels of education. This pattern suggests that highly educated women face greater constraints in achieving their fertility aspirations. However, Denmark, France and the Netherlands diverge from this pattern, as in these countries the risk of experiencing unrealised fertility among tertiary-educated women is similar to or even slightly lower than that among women with less education.
Overall, for the generations covered here, low fertility levels cannot be attributed to low family size ideals. Rather, many women reach the end of their reproductive years with fewer children than they ideally wanted. The continuing shift of childbearing to higher reproductive ages, along with constraints related to partnership opportunities and work-family balance, likely play key roles in limiting the realisation of fertility aspirations.
Figures:
Figure 1: Mean ideal family size, mean actual family size and the gap between them among women
Figure 2: Realisation status of fertility ideals among women aged 42–50
References:
Generation and Gender Programme 2020–2025. Generations and Gender Survey-II Wave 1. https://www.ggp-i.org/data/
Lazzari, E. and Beaujouan, E. 2026. Infertility and unrealized ideal family size. Population and Development Review 52(1). https://doi.org/10.1111/padr.70043
Spanish Statistical Office 2018. Spanish Fertility Survey. https://www.ine.es
Project site: https://biclate.univie.ac.at/
Guillaume Marois, Michaela Potančoková and Ingeborg Spiegeler Castañeda
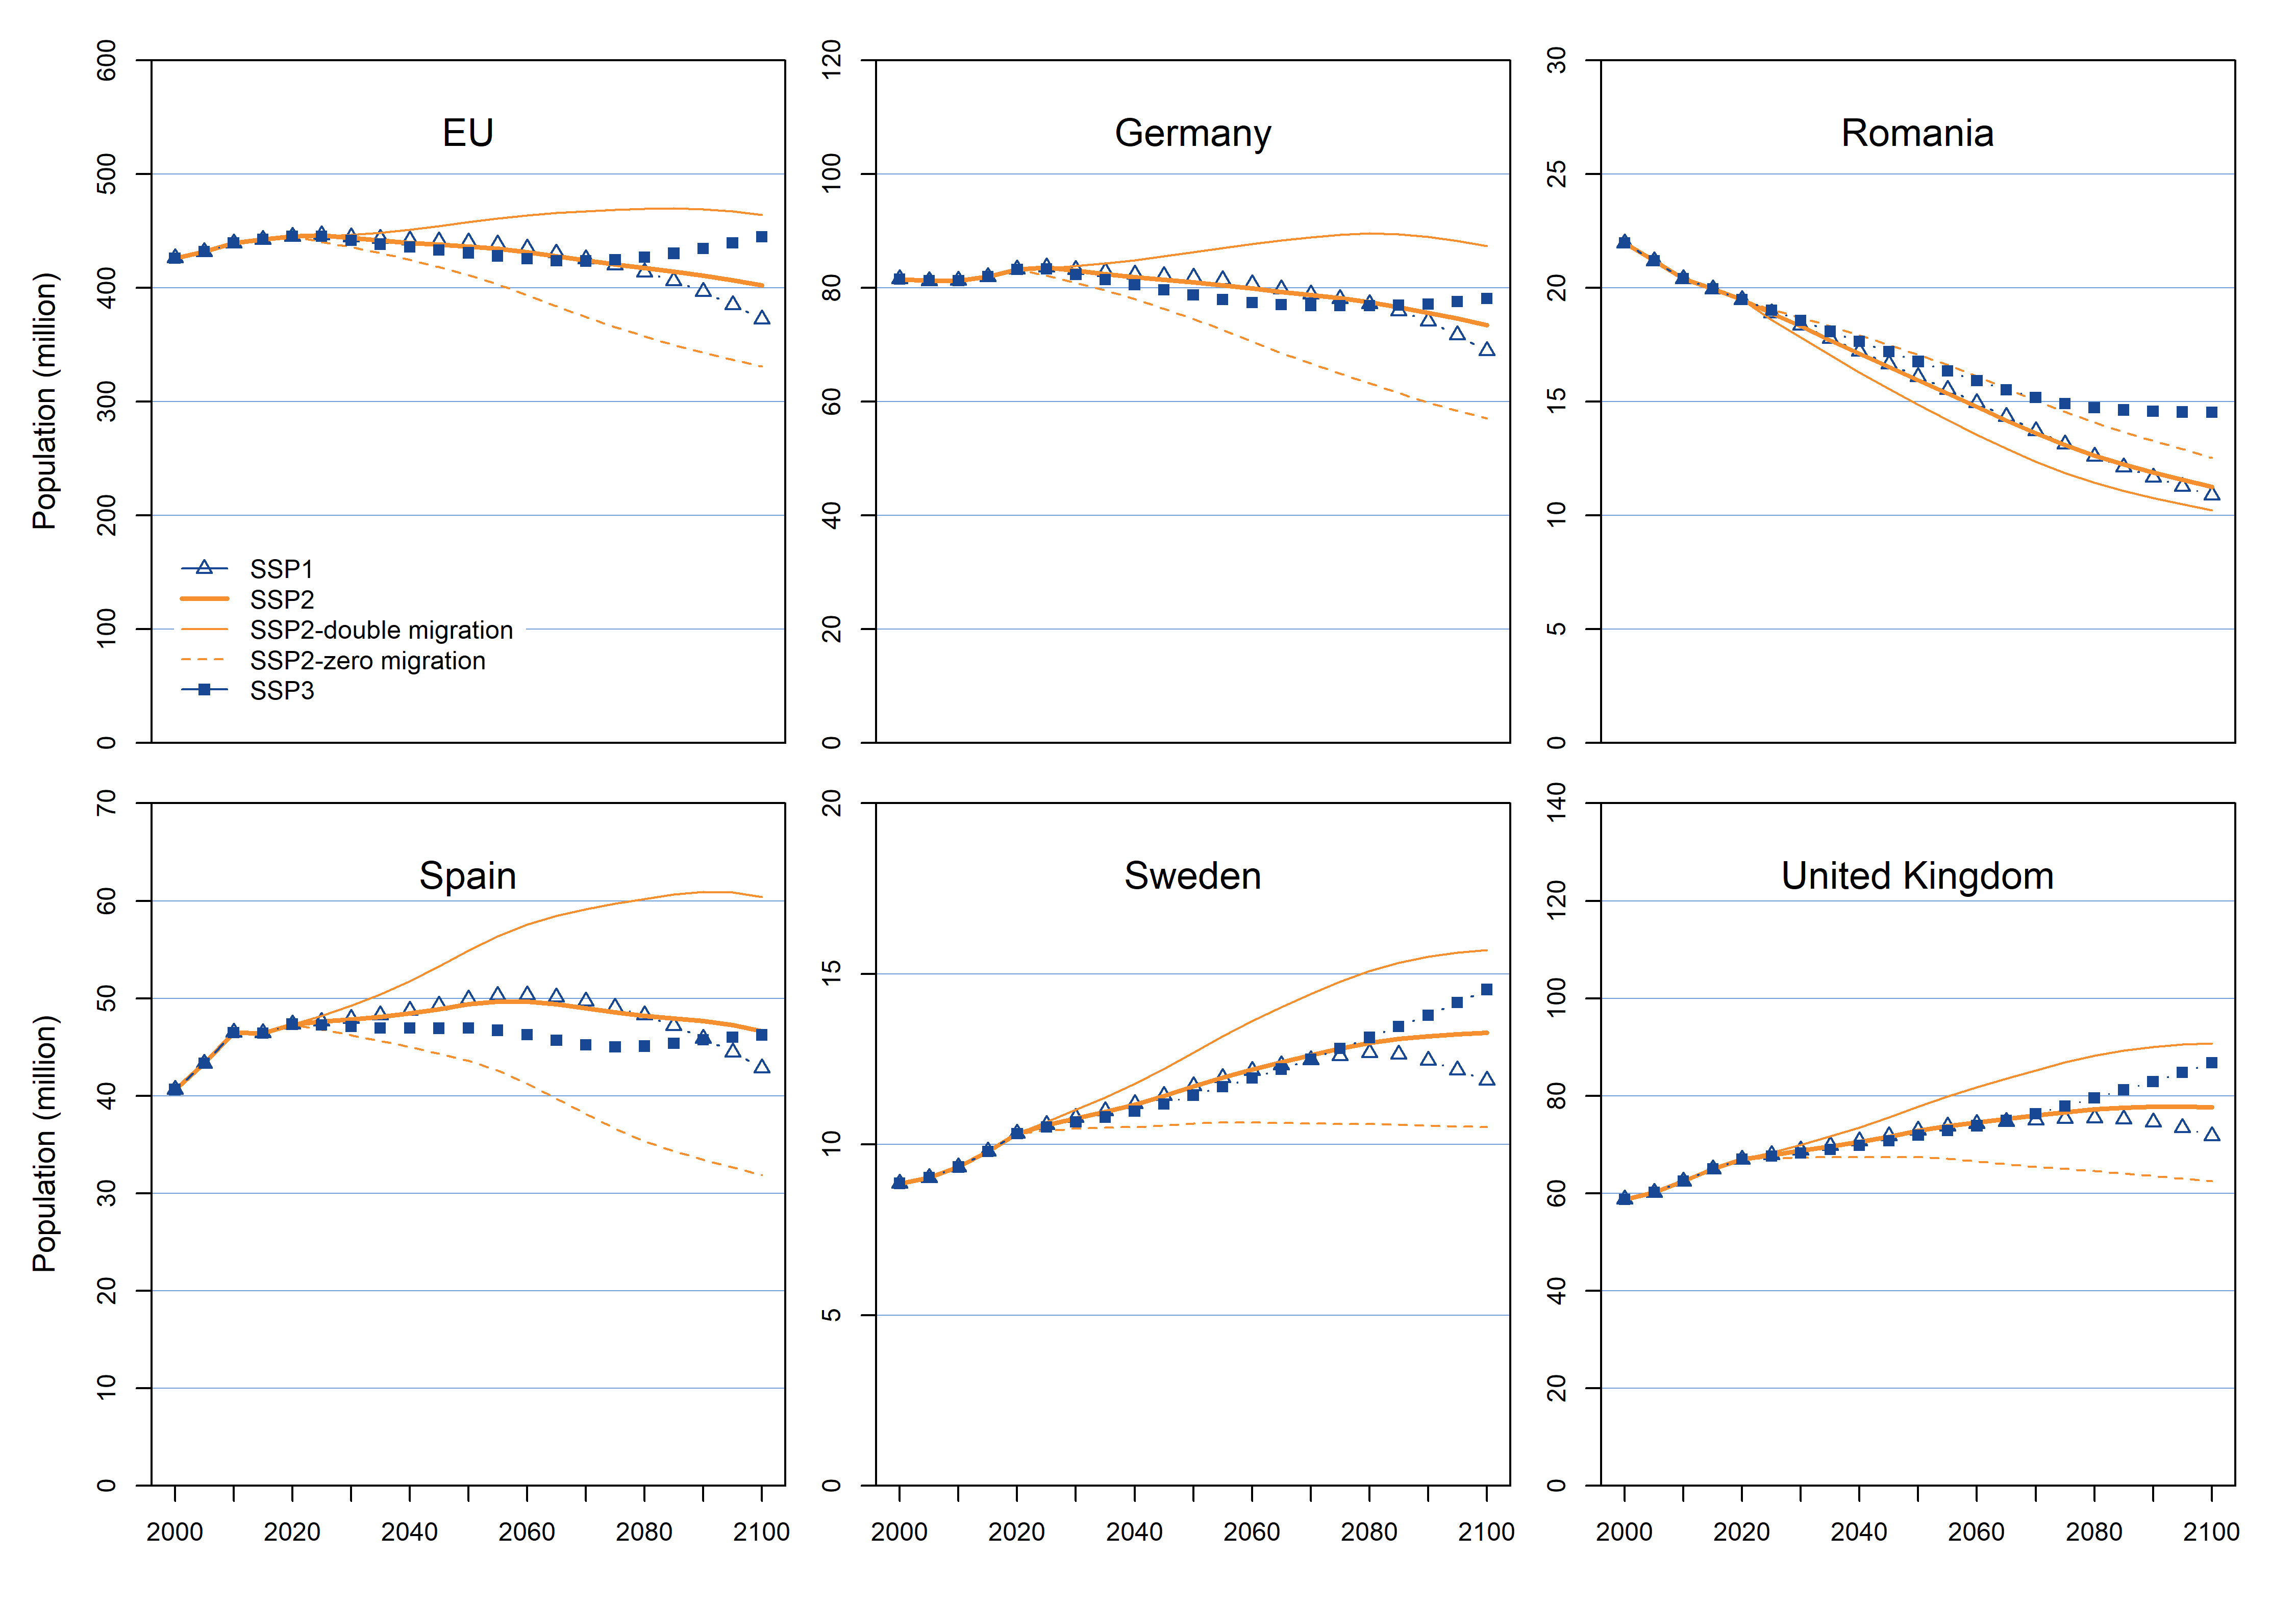
European Union (EU-27) is expected to undergo significant changes in the next decades, driven by population ageing and continuing expansion of higher education. To better understand labour market impacts of these structural shifts, we developed a dynamic microsimulation model (Link4Skills-Mic). This model integrates demographic, educational and labour force trajectories at the individual level and projects the future occupational distribution of workers based on worker characteristics and projected labour demand by skill level.
Overall, total labour demand in the EU is projected to slightly decline from 207 million jobs in 2020 to 198 million jobs in 2060, reflecting slow population growth. However, this apparent stability masks important structural changes. Figure 1 highlights growing mismatches as projected job demand (dashed lines) is not aligned with future labour supply (full lines) at all skill levels. This could exacerbate imbalances between the skills workers have and the available jobs. The projected trends under the reference scenario, which assumes the continuation of past demographic and labour market trends, indicate that demand for high-skilled workers will increase by about 25% by 2060, while the demand for medium-skilled jobs will decline and demand for low-skilled workers will remain relatively stable.
Only for highly skilled the demand and supply increase at the same pace, as younger generations are becoming more educated than previous cohorts. Consequently, the number of workers with low and medium levels of education is projected to decline by around 40% between 2020 and 2060, much faster than the number of jobs requiring these skills. This imbalance will result in fewer workers available to fill vacancies in medium- and low-skilled occupations.
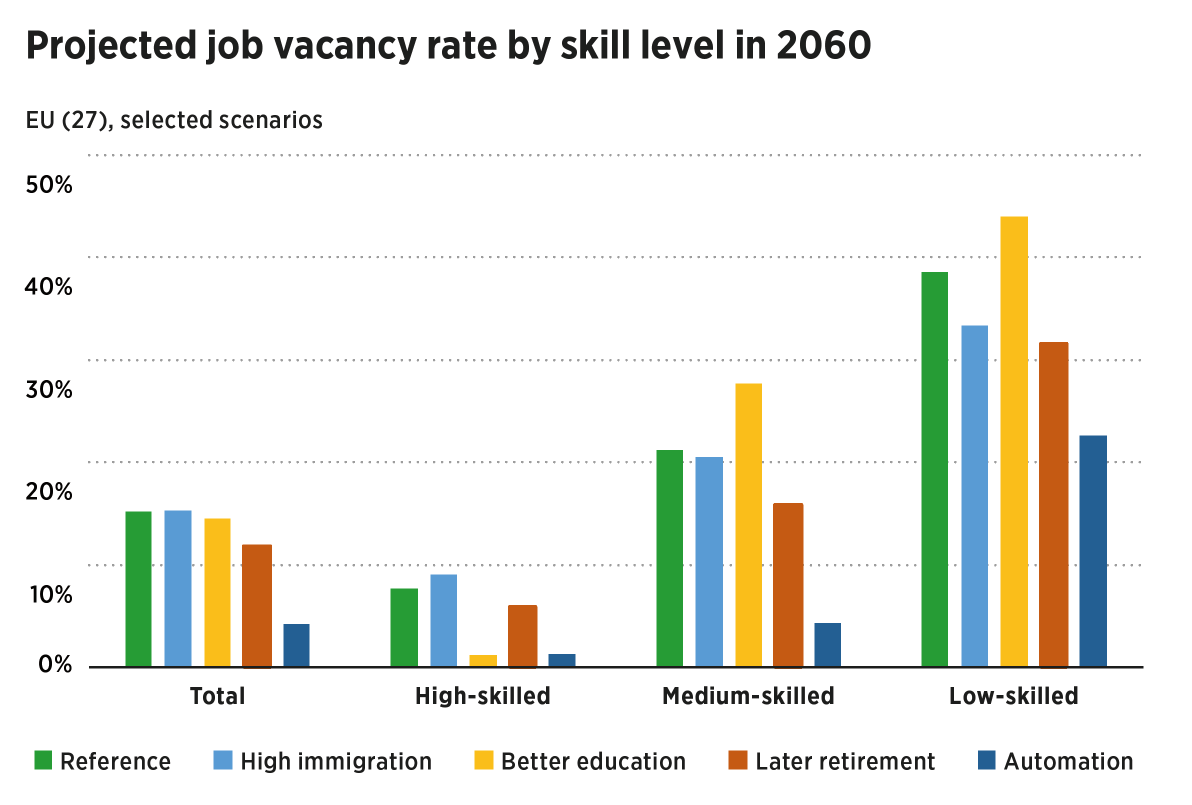
The findings suggest that future labour market tensions in the EU will be driven less by a simple shortage of workers and more by a mismatch between people’s skills and the types of jobs available. To assess how these imbalances can be addressed, we have simulated several scenarios of possible policy responses and compared their impact on vacancy rate (Figure 2) and underutilisation of workers. Expanding education and training can reduce vacancy rate for high-skilled but may increase mismatches elsewhere, while immigration has only a limited impact and later retirement modestly reduces vacancy rates at all skill levels. Automation has the largest impact on vacancy rate, lowering labour demand but increases the risk of underutilisation among highly and medium skilled workers.
In sum, each of these responses can reduce specific imbalances, but no single policy is enough to fully close the gaps that are projected to emerge. Our findings highlight the need for a balanced policy mix of improved training, longer active working lives and automation to effectively address labour market mismatches.
References:
Marois, G., Potančoková, M., Bezat, A. et al. 2026. Projecting labour market imbalances and skill mismatch under demographic change in the EU. European Journal of Population 42(4)). https://doi.org/10.1007/s10680-025-09758-2
Figures:
Figure 1: Projected workforce and labour force demand by occupation in the EU (27), 2020–2026
Figure 2: Projected job vacancy rate by skills required by 2060 (EU, selected scenarios)
Marco Santacroce and Caroline Berghammer
The COVID-19 pandemic led to a major change in how work is organised across Europe. What originated as an emergency public health response – namely, the rapid diffusion of remote and flexible working arrangements – has become an established feature of contemporary labour markets. This transformation is notable not merely for its scale, but also for its persistence after the pandemic and its uneven distribution across populations and countries.
Prior to 2020, access to flexible work arrangements within the EU had stalled. The prevalence of working from home (either sometimes or usually) remained relatively stable over the preceding decade. With the onset of the pandemic, however, there was an abrupt upward shift. The proportion of employed persons aged 25 to 59 engaged in flexible work increased from 15% in 2019 to 25% in 2021 across the EU-27. Importantly, this rise has not been followed by a reversion to pre-pandemic levels, despite the possibility of a full return to offices and workplaces. Instead, flexible work has stabilised at a much higher level, which suggests that it has become a lasting feature of the labour market.
At the same time, the expansion of and access to flexible work have been highly uneven across Europe, amplifying pre-existing regional disparities. Levels of access are substantially higher in Nordic and Western European countries than in Southern, Central and South-Eastern Europe. In the Nordic countries, nearly half of employed persons sometimes or usually work from home. The lowest observed value of 3% in Bulgaria stands in stark contrast to the highest observed value of 60% in the Netherlands.
Beyond geographic inequalities, the distribution of flexible work is differentiated by occupation. Individuals in higher-status, high-skilled positions are disproportionately represented among employees able to work remotely. Thus, the pandemic-induced expansion of flexible work may have intensified disparities between higher and lower socioeconomic groups.
By contrast, gender and parenthood gaps in flexible working are much less pronounced. Despite occupational gender segregation, the shares of women and men who work from home are similar. The gender gap widened somewhat during the pandemic, as working from home became slightly more common among women than among men in most countries. Flexible working is often viewed as a means to improve work-family balance. However, differences by parenthood status remain relatively modest. While parents, especially those with young children, are more likely to work from home, the magnitude of this effect is small.
The post-pandemic stabilisation of flexible work represents a lasting change with important social and demographic consequences. It may, for instance, influence fertility decisions or female labour market participation. As flexible work becomes a regular feature of employment in most parts of Europe, the fact that access differs by country and social group will play an important role in shaping future inequalities.
References:
Eurostat database. Employed persons working from home by professional status - % of total employment. https://ec.europa.eu/eurostat/databrowser/view/lfsa_ehomp$defaultview/default/table?lang=en
Project site: https://www.oeaw.ac.at/vid/research/research-projects/flin
Figures:
Figure: Proportion (%) of employed persons working from home

Bernhard Binder-Hammer
European social transfer systems vary considerably in size and in how they redistribute resources between age and income groups. The extent of pension payments to rich pensioners is a major differentiator of European welfare states. It is closely related to the total size of the social transfer system and the extent of redistribution to the older population.
Benefit ratios can be used to quantify the extent and the direction of social redistribution. We calculate benefit ratios by measuring the total social benefits received by a particular socioeconomic group relative to the total income of households in a country. The old-age benefit ratio measures the social benefits received by the population aged 60 and older relative to the total gross income of all households. The top-half benefit ratio measures the benefits received by the half of the population with the highest equalised income.
The extent of redistribution to the older population differs considerably across Europe: social benefits for the population aged 60 and over account for 11% of the gross income of households in Latvia and for 26% of the gross income of households in Italy. Generally, the old-age benefit ratio is low in the Baltic countries and Ireland, and is high in the Southern European countries.
The degree of redistribution to the older population and the extent of redistribution to the population with high income are closely related. This is because both the high old-age benefit ratio and the top-half benefit ratio reflect pension payments to the population with the highest income. The Baltic countries and Ireland are among the countries with the lowest benefits paid to the richest half of the population, with these benefits accounting for less than 10% of gross income in Ireland, Latvia and Estonia. The welfare states of Czechia, Croatia, Denmark, Switzerland and the Netherlands are also characterised by particularly low levels of redistribution to the richest population. By contrast, the Southern European countries are among those with the highest benefits for the richest half of the population, accounting for more than 17% of gross income in Portugal, Greece and Spain, and for a staggering 22% of gross income in Italy.
The Netherlands, Denmark, Sweden and Switzerland form an equalising cluster of countries. In these countries, where mandatory funded pensions play a large role, the top-half benefit ratio is low compared to old-age spending. The clear relationship between individual contributions and the size of pensions in funded systems curbs pension claims, which in turn reduces the redistribution of wealth towards the higher-income groups.
References:
Hammer, B., Christl, M. and De Poli, S. 2023. Public redistribution in Europe: Between generations or income groups? The Journal of the Economics of Ageing, 24(100426). https://doi.org/10.1016/j.jeoa.2022.100426
Figures:
Figure: Relation between redistribution to the older population and the income-rich, 2022
Andrea Tamburini and Anne Goujon
Intergenerational poverty risk is shaped by welfare institutions, demographic change and economic and political transformations.
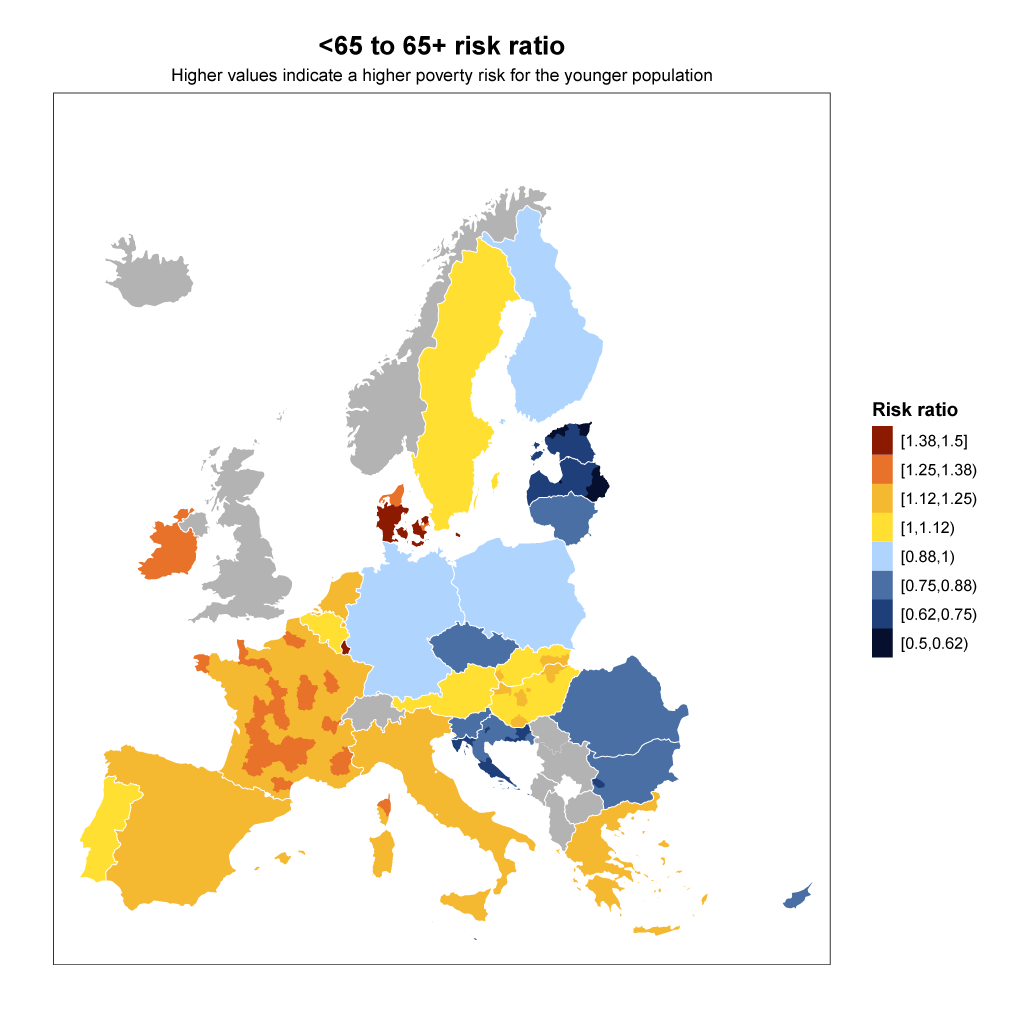
The map illustrates regional disparities in the age profile of the risk of poverty or social exclusion. Specifically, we consider the ratio of the risk of poverty or social exclusion in the population below age 65 to the risk in the population aged 65 and over., using EU-SILC data at NUTS 3 levels (small-sized regions such as districts, with 1164 regions in the European Union). A value above 1 (red colour shades) indicates that the younger population faces a higher risk than older people, while a value below 1 (blue colour shades) means that the elderly are more exposed.
The map shows that poverty and social exclusion in Europe are strongly age-structured. This inequality varies across Europe depending on the national context. Although some regional variation exists within countries, national welfare regimes, pension systems, labour market structures and family support arrangements remain the main drivers of the observed spatial divides, making sub-national variation relatively weak. The speed and the extent of ageing are also relevant, because in countries where the share of older people is growing rapidly, this trend influences the distribution of public resources and social protection, sometimes strengthening the relative position of retirees while increasing the economic pressure on younger working-age groups.
A first clear pattern is found in the Baltic states and parts of Eastern Europe, where older people are often more exposed to poverty and social exclusion than the population below age 65. This pattern reflects a long-standing divide in several post-communist settings, where pension levels have remained relatively low; wealth accumulation for the current elderly was limited in the past; and the transition to market economies created uneven protections across generations. In these contexts, the elderly have weaker financial buffers and fewer opportunities to compensate for income gaps than the younger generations, who could benefit from the robust economic growth of the 2000s and 2010s.
By contrast, in Southern Europe and parts of Northern, Central and Western Europe, the opposite pattern is observed. In Spain, Italy, Greece and France, people below age 65 are more likely to be at risk of poverty and social exclusion than those aged 65 and over. Younger and working-age adults have been more directly affected by increasing labour market insecurity. At the same time, pension systems continue to offer stronger protections to older generations, especially when compared with the weaker support available to younger cohorts with children or unstable employment. The result is a marked intergenerational divide in which older people often appear to be economically better protected than younger adults.
Some European countries, such as Finland, Germany, Poland and Portugal, have a balanced risk ratio by age of around 1.0, with older and younger age groups facing similar risks of poverty and social exclusion. The welfare policies and levels of employment stability in these countries vary considerably, which suggests that different social policies can lead to a similar prevalence of poverty among younger and older generations.
References:
Eurostat. At risk of poverty or social exclusion (AROPE). https://ec.europa.eu/eurostat/statistics-explained/index.php?title=Glossary:At_risk_of_poverty_or_social_exclusion_(AROPE)
SPARCCLE project: https://sparccle.eu/2024/09/13/atlas-of-demography-story/
Figures:
Figure: Risk of poverty or social exclusion (<65 to 65+ risk ratio)
Poster
Graphic design
Christian Höegl, https://www.creativbox.at
Printing
Print Alliance HAV Produktions GmbH, 2540 Bad Vöslau, https://printalliance.at/
Publisher
Vienna Institute of Demography, Austrian Academy of Sciences, Dominikanerbastei 16, 1010 Vienna, Austria, https://www.oeaw.ac.at/vid/
Release date
1.6.2026